
The Punchbowl of Death (POD) is an interesting short-sale set-up or formation that I first observed in the 1990's when I was first able to study the charts of big, winning stocks from earlier, historical market periods. This is certainly one punchbowl you don't want to be drinking from! Obviously, the terminology I chose here is derived from the fact that these big, double-top type set-ups that are regularly seen as weekly chart topping formations in big, former market leaders resemble massive, over-sized "cup" formations. But nobody drinks from cups that big, hence the term "punchbowl." Punchbowls are big bowl-like things, and can often be "spiked" with certain dangerous "ingredients," so I felt this term was quite appropriate for this type of formation.
I don't have historical charts of these stocks available to publish here in this article, but two historical examples that first caught my eye early on with respect to this Punchbowl of Death short-sale set-up idea were Syntex from 1962-1966 and Simmonds Precision Products from 1964 to 1966. Syntex had a huge move from about May 1963 to January 1964, rocketing from about $10 a share up to nearly $100 a share. After topping out in January of 1964, Syntex then plummeted nearly 75% off its highs before bottoming out at around $25 a share in late 1964. From there the stock began another upside move that terminated in early 1966 at just over $120 a share before the stock finally topped for good. Simmonds Precision came public in mid-1964, ran up from around $2.50 to around $7.50 a share before forming a cup-with-handle base from which it broke out of in early October 1965 and ran up to about $60 a share in April of 1966. The stock then formed a nearly 50% deep "cup" and made another run at its highs to complete a "punchbowl" type of set-up before topping for good. What I found interesting was this idea that these huge, winning stocks that no doubt investors start salivating over once their moves become obvious are often able to rally back up to their prior highs one more time before topping for good. Usually these rallies back up to the highs occur in a second or later leg in an overall bull market, or during a bear market rally.
If you want to learn how to short sell stocks based on a POD formation, it is helpful to understand the basic psychological and technical concepts that provide the context within which a POD is able to form. The essence of a POD can be seen in the weekly chart of Ariba, Inc. (ARBA) in 2000, shown below. ARBA was a hot stock as a Business-to-Business e-commerce play, affectionately known as "B2B" during the internet bubble of the late 1990's, and it went into a parabolic move into early March 2000, initially topping at the same time, more or less, as the general market at the time. The decline in the general market took ARBA down with it as the stock corrected over 70% from its March 2000 peak. This is the initial characteristic of POD formation: a sharp decline off the peak after a leading stock has had an accelerated upside move. This is then followed by a short bottoming process and then another sharp move to the upside that approaches or exceeds the prior high on the left side of the giant "bowl" or POD formation.

Let's break this down a bit further. In 1999-2000, two stocks I was intimately familiar with because I was long them at some point during their big prices moves, America Online (AOL then, but TWX now) and Schwab Co. (SCH then, but SCHW now) formed punchbowl of death topping formations. It was at this point that I began to catalog these formations and their basic features. As the weekly chart of TWX (AOL from that period) shows below, the "POD" is formed in four major "movements," labeled A through D on the chart. Movement A is the initial "hot stock" price run that usually creates a great deal of excitement and which gets ever more obvious as the stock continues to run ever higher. AOL/TWX finally topped out in the first quarter of 1999 at H1 and then broke down hard on the price decline labeled "B," eventually bottoming in the summer of 1999. From here the stock began rally "C" to complete the right side of the "punchbowl" formation before topping out at H2, which just exceeded the prior high at H1. This is a typical feature of POD formations, although the H2 high does not always have to be higher than H1 – sometimes they can be roughly the same or H2 can be lower than H1, as we will see in some of the forthcoming examples, below. This secondary rally "C" took place once another major bull leg began in the market in October 1999. Once AOL/TWX topped out at H2 it was all over.

While there are always exceptions, I believe that most PODs work as topping formations because the rally on the "C" leg of the formation simply cannot be sustained after such a severe break down. The initial break off the peak on the "B" decline is a sign that the stock is enduring a wave of institutional distribution which likely later resumes at H2 when the stock gets back up to its old H1 high. This is the "psychological context" of a POD.
Charles Schwab Corp. (SCHW) was another short sale set-up POD stock that topped in early 1999 but again revisited its highs in early 2000 after a new bull leg had started in October 1998. SCHW is interesting because it actually formed a "double POD" type of formation, making one more attempt at is highs on H3, as the weekly chart below shows. Of course, you could have shorted the stock off the H2 high and done quite well, and it is not often that you get a second chance at shorting a POD. But SCHW did form a second POD which has the look of a big, ugly cup-with-handle formation before failing off the handle and topping for good.

While the AOL/TWX and SCHW examples are longer-term PODs that take about a year or more to form, shorter-term PODs can also be found from time to time, usually in a very, very hot IPO that has some very hot theme driving it, such as Taser International (TASR) shown on a weekly chart below. TASR started trading in mid-2001 and eventually tripled following the boost it got right after 9/11, but the stock rolled over and broke down before getting hot again in 2003 and setting off on a seven-fold price move. TASR topped out in April of 2004 at H1 before forming a bottom and then a re-test of that bottom in July/August of 2004. From there the stock formed a little cup-with-handle which looked constructive as the stock broke out and pushed towards the old H1 highs at H2 and then continued to a marginal all-time high at H3 before busting wide open in rapid fashion. One thing to note on the TASR chart below is that the rally up into the H2 and H3 highs occurred in the latter half of 2004 when the market began another leg up in the overall 2003-2007 bull market phase.

Amazon.com (AMZN) was another example of two shortable POD formations that made great short selling candidates, the first coinciding with the market run in late 1998, and the second with the market run in late 1999.

Historical precedent also exists for the POD formation. When I saw Dryships (DRYS) start coming up off its lows in January of this year and then retest those lows in March, as the weekly chart below shows, I remembered the TASR example, above, with the similar retest of its lows, move to new highs, and final top. I had initially viewed DRYS as a buy off the retest of the lows in March-April as the stock was working its way up the "C" leg of the formation and did in fact play this short upside move. This was just a simple matter of recognizing that DRYS was forming a possible short sale POD formation, and in order for it to complete the formation I knew it would have to form the "C" leg which would have to be a sharp rally back up towards those $100-plus price highs. In addition, the market began a bear market rally in March of 2008 and thus we must remember that these "C" leg rallies that complete the right side of the POD in big former leaders usually occur in secondary bull market legs or bear market rallies – that is a very important concept to understand about PODs. Once DRYS got up over 100 however, I shifted my view on the stock and began suggesting it as a short.

What is even more fascinating about the DRYS example, above, is that it resembles almost exactly Reading Railroad's POD topping formation in 1907! The best I can offer is a ratty, old, scanned copy of the Reading Railroad weekly chart from 1907, which is shown below, but you get the idea.

The similarity between DRYS of 2007-2008 and Reading Railroad in 1907 is uncanny, to say the least. While the railroads were very hot stocks in the early 1900's, the ocean-going shippers were equally as hot in 2007-2008, over 100 years later, and Reading Railroad, one of the hottest railroad stocks in the early 1900's, topped in the exact same fashion that DRYS did. And if anyone questions the validity of this formation, I would point out that in this bear market, many of the biggest leaders in the immediately prior bull market of 2003-2008, such as Apple Computer (AAPL), Baidu.com (BIDU), Google (GOOG), First Solar (FSLR), and the shipping stocks as well as many others all topped out from POD formations.
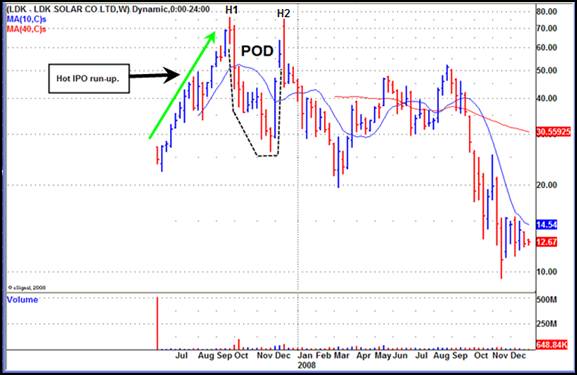
Short selling POD patterns in hot IPOs or recent new issues (within 1-2 years) can even be shorter than the TASR example, above, as the weekly chart of LDK Solar (LDK) shows below. While the solars were on fire in 2007, LDK came public and immediately took off on a 244.6% price run before topping out at H1 and plummeting back to earth. The stock then put in one, brief, 2-3 week "C" leg rally back up the right side to H2 before reversing on the weekly chart and topping for good. This whole POD took about three months to form, but the concept is pretty much the same as any other POD topping formation. A very, very hot stock that gets a lot of attention, runs up fast, blows up, runs up again to or near the prior high, and then tops for good. In each case, I believe the "C" leg rally up the right side of the punchbowl is caused by the fact that many investors who missed the initial "hot stock" run up on leg "A" see the stock as "cheap" when it declines so sharply off the H1 peak that they all come piling in to take advantage of the great "bargain" and drive the stock up to H2, where the stock forms what is essentially a type of double-top. If you were able to see a chart of Simmonds Precision Products from the 1964-66 period, right at its top it formed a POD somewhat similar to LDK's formation after its "hot IPO" price run-up, hence the shorter "IPO POD Formation."
Another stock that provided a nice "IPO POD" short-sale set-up in 2008 was JA Solar Holdings (JASO), below. Oftentimes the best PODs to short on the right side of the pattern are those that are the narrowest. Note that right off the peak in early January JASO took 18 weeks to form the entire pattern and then fail from that point.

In my studies of PODs, I have noticed that there are several different variations on the theme, and like we saw above some PODs can be long-term, some short-term, some even "double PODs" as in the example of SCHW. Sometimes we even see what I call "slow stock" PODs such as that seen in International Game Technology (IGT) in 2008. As the weekly chart below shows, IGT has a pretty upside leg "A" as it runs up to the first high before forming the POD. As it comes around it tries to form what is really an improper, big, cup-with-handle from which it breaks out once and fails, twice and fails, and finally a third time that looks more convincing before actually failing again. Notice how after the second breakout attempt the stock fails and breaks down very sharply before turning all the way around and pushing out one more time to a third breakout. Note that the general market had actually topped right after the first breakout, labeled "1" on the chart.

Short sale POD topping formations can also morph into other types of topping formations such as what I like to call the "big head" head and shoulders formation. As I pointed out during a presentation to individual investors in New York in July of 2008, First Solar (FSLR), shown on a weekly chart below, was starting to look like a big head and shoulders formation after topping from its original POD formation. I was pointing out FSLR's POD topping formation much earlier in 2008 before the stock topped out, it was interesting to see how it formed out further as a "big head" head and shoulders formation.

In fact FSLR mimicked the historical example of Broadcom Corp. (BRCM) in 2000-2001, as we see in the chart of BRCM from that period, below. BRCM's overall pattern was very similar to what FSLR was forming by July of 2008. FSLR eventually followed in BRCM's footsteps by breaking down in similar fashion, and by the summer of 2008 FSLR's resemblance to BRCM back in early 2001 as it also morphed from an original POD top to a "big head" head and shoulders formation was still intact.

Even AAPL in 2008 had some similarities to BRCM in 2000-2001 in that it formed a big POD-with-handle type of formation that was also similar to FSLR's during the same period.
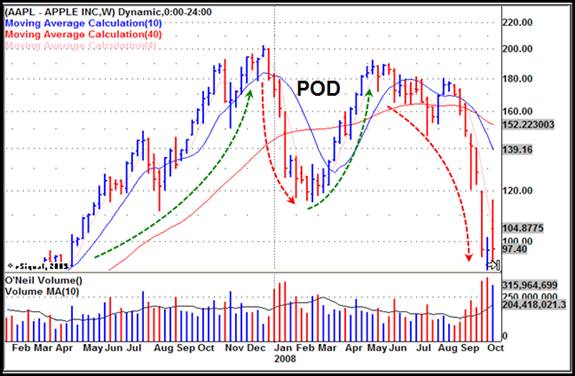
If played correctly, short sale set-up POD formations can offer some of the most rewarding downside short-sale plays, but timing is critical. In all of the examples shown above in this article, note that once the stocks break down below the 10-week, or its daily equivalent in the 50-day, moving average on the right side of the formation that is the general point at which the stocks should be shorted. Using the 10-week or 50-day moving average at that point also serves as a ready guide for your upside stop, and would-be POD short-sellers should also keep in mind that this can require some persistence. Note how in the AAPL example, above, the stock starts to break down below the blue 10-week line a few times, even finding resistance at the line in the May-June 2008 time period, and then rallying above it one more time in July 2008 before it finally rolls over. Finally, as the general market began to break in late August/early September 2008 AAPL also split wide open, which illustrates how the breakdown off the right peak of any POD will almost always coincide with a market down leg. This is an important short-selling tip, which is that short-sale target stocks must always be handled and shorted in conjunction with a downside market break where the odds of success are much higher. As with most short-sale set-up situation, swimming with the tide of the market increases your odds of success.