
FAQs Frequently Asked Questions
The last few years have been extremely challenging for timing systems. These years were fraught with much sideways, trendless action as well as numerous false price/volume signals in 2007. That said, there are ways to boost your return in these challenging times. Returns can be boosted by going long or short 2-times or 3-times ETFs that serve as good proxies for the NASDAQ Composite. Since many ETFs highly correlate, there are many to choose from. However, if you wish to stay as close as possible to the NASDAQ Composite, the best ETFs would be the 2-times QID/QLD and the 3-times TYH/TYP or TQQQ/SQQQ. See the discussion on the returns the model would have achieved using the TYH during 2009 in the FAQ "What are weaknesses of the model."
Case in point: Theoretical results trading TYH from March 12, 2009 to August 24, 2009, which experienced two uptrends and a period of trendless volatility where the system had four false signals in a row [100% long on buy signal, 100% short on sell, 100% cash on neutral]:
| Nasdaq Composite |
$1 becomes |
TYH (3x ETF) |
$1 becomes |
||
| 3/12 |
Buy |
1426 | 1.21 | 45.3 | 1.63 |
| 5/28 | Short |
1728.9 | 1.18 | 73.8 |
1.5 |
| 5/29 | Neutral |
1768.2 | 1.18 | 79.9 | 1.5 |
| 6/1 | Buy |
1828.6 | 1.16 | 88.1 | 1.46 |
| 6/17 | Short |
1795.5 | 1.14 | 85.3 | 1.39 |
| 6/19 | Neutral |
1831.1 | 1.14 |
89.4 | 1.39 |
| 7/7 | Short |
1770.1 | 1.13 |
81.3 | 1.33 |
| 7/13 | Buy |
1793.2 | 1.27 |
85 | 1.90 |
| 8/24 | 2018.0 (close) | +27% | 121.4 | +90% |
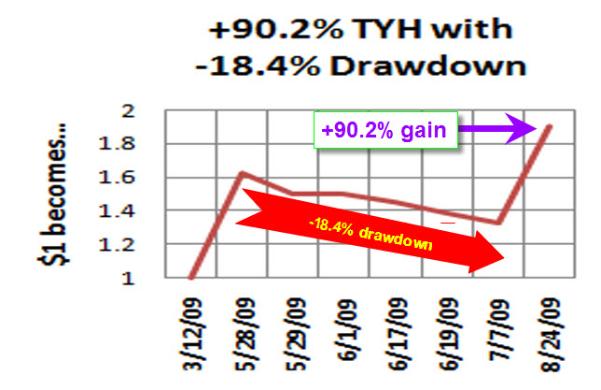
As you can see, using TYH yielded a +90.2% return from March 12, 2009 to August 24, 2009 which is stellar, however, you had to endure four false signals which totalled to a -18.4% drawdown, on the way to being up +90.2%. In addition to 3-times ETF TYH, we will provide 1-times and 2-times ETF ideas so one can still profit but with more limited drawdowns.
Even the Decision Moose market timing site run by William Dirlam, which has a sound track record, wrote the following in their January 15, 2010 weekly summary:
Looking back, 2009 was the worst year I can remember for the Moose (+1%), especially relative to the S&P (+26%). Of the last four non-cash switches post-2008 crash, two (T-bonds and gold) were losers. One (EPP) was a winner, and the latest (ILF) is flat to slightly underwater. It shows how government intervention can distort normal market activity by truncating trends and causing price spikes (bonds) and collapses (gold). It also shows how extremely volatile price action can render an intermediate term trend-following mechanism virtually useless in the short term.
The table below shows top-performing trend-following funds whose portfolio managers have been celebrated in Jack Schwager's Market Wizards books, Michael Covel's book Trend Following, and the highly successful “Turtles” investors. The Turtles were spawned from market wizards Richard Dennis and William Eckhardt, who embarked on a program to prove that individuals who had the proper psychological characteristics could be taught to trade profitably. In the process, many of the individuals they trained, the Turtles went on to become highly-respected and successful trades in their own right. As you can see from the table, many had a tough time in 2009 despite their prior exemplary track records.
Trend Following Wizards 2009 Performance*
| Fund Name | Assets Under Management | 2009 Performance (%) |
| Abraham Trading | N/A | -5.56% |
| Aspect Capital | $473 million | -9.11% |
| Chesapeake Capital | N/A | +0.41% |
| Clarke Capital | $1.046 million | -29.78% |
| Drury Capital | $18 million | +9.05% |
| Dunn Capital | $151 million | -0.58% |
| Eckhardt Trading | $220 million | -4.80% |
| EMC Capital | $445 million | -14.29% |
| Hawksbill Capital | $212 million | -15.32% |
| Hyman Beck & Co. | $51 million | +3.96% |
| JWH & Co. | $462 million | -17.28% |
| Man AHL Diversified | $18 million | -16.40% |
| Millburn Ridgefield | $1.414 million | -8.66% |
| M Rabar Market Res. | $1.137 million | +6.93% |
| Saxon Investment | $222 million | +10.37% |
| Superfund | $11 million | -24.46% |
| Transtrend | N/A | -11.28% |
| Winton Capital | $4.768 million | -4.63% |
*Jez Liberty - http://www.automated-trading-system.com/
| First published: | 22 Jun 2010 |
| Last updated: | 22 Jun 2010 |