
Buying Base Breakouts: Do They Still Work?
By Dr. Chris Kacher & Gil Morales
We are often asked whether the time-honored O’Neil-style method of buying technical base or consolidation range breakouts still work as a basic investment technique. The idea of purchasing a stock when it “breaks out” of a sideways price range on the upside has been a time-honored technique for individual investors since it was first popularized by William J. O’Neil in his seminal work, “How to Make Money in Stocks” which became an investment classic.
Intuitively, its logic is simple if not compelling. Think about it this way: if a stock that has been moving sideways around the 50 price level for a period of time is set to double in price, this will first manifest as a move to 51, 52, 53, 54, etc. Buying it when it clears the top of the sideways consolidation is therefore rooted in a certain basic logic.
But a market environment where money flows are determined mostly by the influx of quantitative easing (a.k.a. money printing) by central banks around the globe, a sort of “sloshing” of money back and forth can create a highly rotational environment. In this case, breakouts may have a lower probability of working, or they may result in price moves of lesser magnitudes. Thus, the stock that is set to double in the example from the prior paragraph doesn’t quite make it. Instead of going from 50 to 100, it only goes from 50 to 60, and then tops.
In some cases, stocks may simply swing back and forth for long periods of time without ever breaking out to new highs. Instead, they may move up and down within large price ranges. However, the moves themselves represent sub-trends within an overall trendless pattern that can become playable for profit if one knows how to capitalize on them.
Take the example of Tesla (TSLA). Here we see a stock that has been moving back and forth for the past three years as it forms a wide-ranging consolidation without ever breaking out to new highs. The red and green arrows on the TSLA weekly chart, below, denote sharp up and down price movements within the pattern. However, each of these sub-trends is quite playable for those who do not rely exclusively on base breakouts.
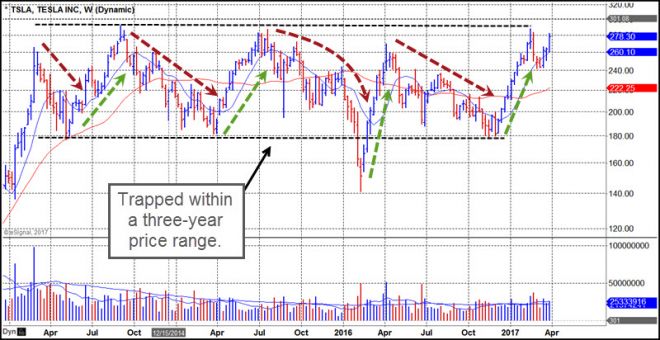
In this manner, we don’t have to worry about whether standard old-school base breakouts work or not, or just produce 10-20% gains. We can get in well before any breakout by playing the sub-trends within the overall consolidation.
The last green arrow on the weekly chart, above, can be viewed on a more granular level on the daily chart, below, which shows that sharp upside price move in more detail. Using one of our buying methods, known as “pocket pivots,” we can in fact determine valid buy points within the pattern that are near the lows of the three-year price range without having to wait for a range breakout.
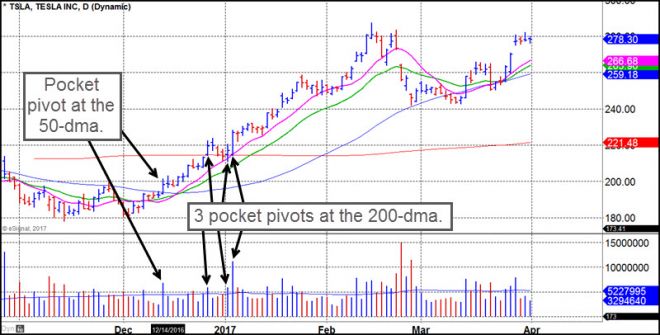
In the case of TSLA, we can see that the stock issued a “bottom-fishing” type of pocket pivot as it pushed up through the 50-day moving average (blue line) on strong buying volume. Two weeks later, the stock then issued three more such pocket pivots as it came up through the 200-day moving average (red line) in late December 2016 and early January 2017.
By using these types of buy signals, investors can gain a significant edge vs. simply having to watch TSLA rise before it breaks out through the “ceiling” of the current three-year price range. And if TSLA does eventually break out to new highs, whether it doubles or goes up 10-20% is less of an issue since anyone who bought the stock on the prior pocket pivots deep down in the pattern at around 195 and then 220 is already sitting on a big profit.
These are just a few of the techniques we teach, and they are rooted in the philosophies of three great traders: William J. O’Neil, Richard D. Wyckoff, and Jesse Livermore. Such techniques comprise an over-arching investment approach and philosophy that we call the OWL™ (O’Neil-Wyckoff-Livermore) Method. Our techniques can give investors a substantial edge in both difficult and more generous markets that would otherwise not be available using more standard, orthodox methods.
Indeed, buying stocks at entry points where your risk is typically 2-3% or less is another technique that has worked exceptionally well over the last few years. We discuss various techniques in our Focus List reports emailed to members regularly. Here are some examples (1 month time-delay for non-members):
https://www.virtueofselfishinvesting.com/reports/search?p=1&q=focus%20list&sort=date