
FAQs Frequently Asked Questions
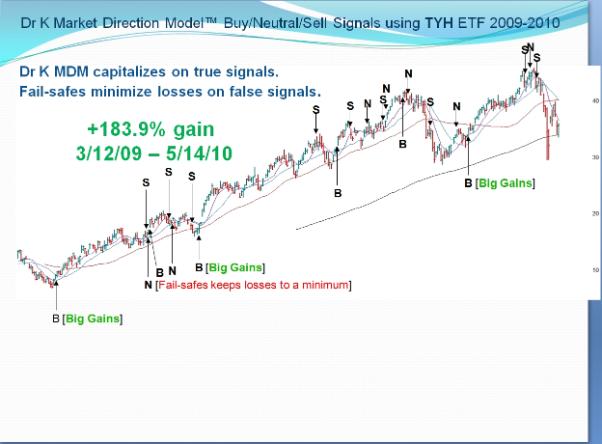
High returns come with drawdowns that you may find are outside your comfort zone. Thus we will provide suggestions on 1-times, 2-times, and 3-times ETFs, depending on your risk tolerance. My Market Direction Model™ is up +47.5% from June 1, 2009 - May 14, 2010 (the date of this writing) in a test fund using actual money, with exposure to the market less than half the time. In a separate account that is not using actual money, I wanted to see how my system held up against a volatile instrument such as the 3x technology ETF TYH, going 100% long on buy, 100% short on sell, and 100% cash on a neutral signal. Such instruments did not exist until the last year, so this gives big opportunity for profit that did not exist before. From March 12, 2009 - May 14, 2010, it is up +183.9%. Of course, due to the highly aggressive nature of this account, drawdowns as high as -18.5% were not unusual but that is the price to pay to get to +183.9%. Note, had you been using a 1-times ETF, your gains would be roughly 1/3 of those shown, but so would your drawdowns. Thus the worst drawdown recorded by the model is -15.7% in 1999 based on the NASDAQ Composite which is, by definition, a 1-times vehicle. Also note, the long term returns of +33.1% from July 1974 - January 2010 are based on the NASDAQ Composite, a 1-times vehicle. If one were to have invested in ETFs such as TYH that were roughly 3-times the movement of the NASDAQ Composite had they existed then, returns would be roughly 3-times the amount but *IMPORTANT* so would be the drawdowns.
The chart below should give you an idea of how the model works. It capitalizes on trends when the signal is profitable as denoted by the [Big Gains] moniker, then a fail-safe mechanism kicks in to limit losses if the signal is false.
For nearly two decades, the model has been a big driving force to our trading success as it keeps us on the right side of the market. The model's returns of +33.1%/yr for the systematic portion date back to July 1974. The last few years have been highly challenging due to sideways, choppy, often trendless markets. That said, the model was still able to outperform with a +17.3%/yr return going back to January 2005, beating the major indices and the top timing sites, and actual returns were greatly enhanced by buying top quality stocks in top industry groups on buy signals, especially during mid/late 2006 and late 2007. Furthermore, a +51.9% (17.3% x 3) return could be achieved since the birth of 3times ETFs such as TYH/TYP that make good proxies for 3-times the NASDAQ Composite. In other words, such instruments tend to return 3-times what the NASDAQ Composite would return. That said, a +90.2% return could have been achieved from TYH/TYP since the March 12, 2009 follow through buy signal through August 24, 2009, the date the study was done (see FAQ below). Keep in mind you would have had to withstand an -18.4% drawdown on the way to +90.2%. For those with lower risk appetites, there are also the 2-times ETFs such as QLD/QID and 1-times ETFs such as QQQQ/PSQ. We will provide ETF suggestions for 1-times, 2-times, and 3x-times ETFs by email each time the model issues a buy or a sell signal. Two of our other services, Pocket Pivot Review and Buyable Gap Ups, email you stock suggestions for potentially larger gains since we all want to achieve that brass ring 100% in a year's time if the market allows.
In addition, keep in mind that results above do not include commissions, taxes, dividends earned, or money market interested earned while in cash from a neutral signal. And always remember, past results are not indicative of future performance.
| First published: | 22 Jun 2010 |
| Last updated: | 26 Aug 2012 |