
Market Lab Report
by Dr. Chris Kacher
The Web3 Evolution Will Not Be Centralized™
China's Evergrande filed for bankruptcy. Evergrande is the world's most heavily indebted property developer and many fear that the recent real estate problems could spread into other parts of the economy. This has been a two year story for a hopeful recovery but such is not the case. It's geopolitical stance as a manufacturing hub is starting to break. This will slowdown trade and global economic activity. China's economy is hurting which hurts the world. And the degree of hurt is not transparent as its government continues to block the release of certain key economic reports.
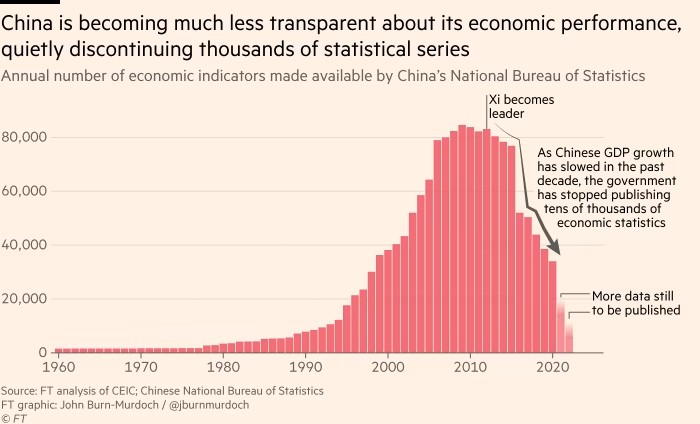
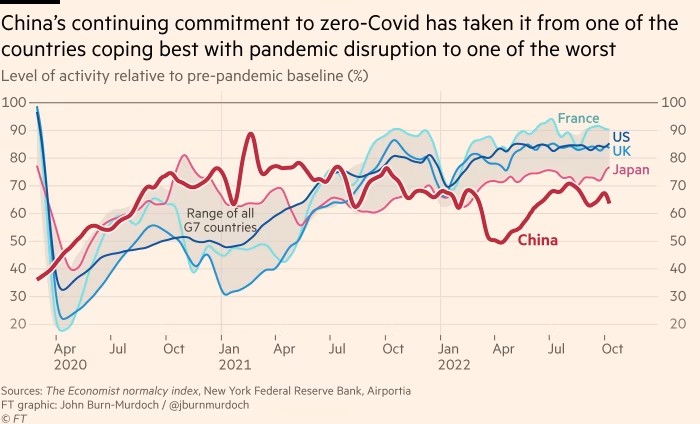
China most recent is indefinitely delaying the publication of headline third-quarter indicators. Part of the negative impact is due to China's handling of Covid.
Hawkish Fed
Further, global liquidity continues to fall. The Fed will either tighten or hold rates at elevated levels if economic conditions warrant and to also bring inflation down to its 2% target. This will put further pressure on stocks and cryptocurrencies. Alternatively, the economy will start to falter forcing the Fed's hand to start lowering rates. Either situation is bearish for stocks and cryptocurrencies as history shows. Once rates start to drop after a period of tightening, stock markets start to or continue to trend lower as recession typically hits shortly thereafter.
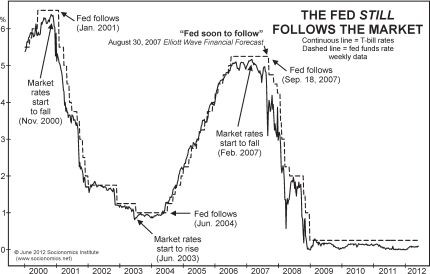
History over the last century shows us that when the Fed starts to pivot to lowering rates, it is too late. Unemployment soars, people spend less, earnings plummet, and the question is how deep and long does the recession last? Rate hikes break something material in the economy, but such hikes are inevitable especially when trying to unwind a massive bubble or tame inflation. Today, we have both. So despite the Fed cutting rates, the stock market continues to fall. This was true in 1930-32, the 1970s, and 2000-02. Ultimately, the Fed follows the market. When the market has material gains, they hike rates. When the market has material losses, they reduce rates.
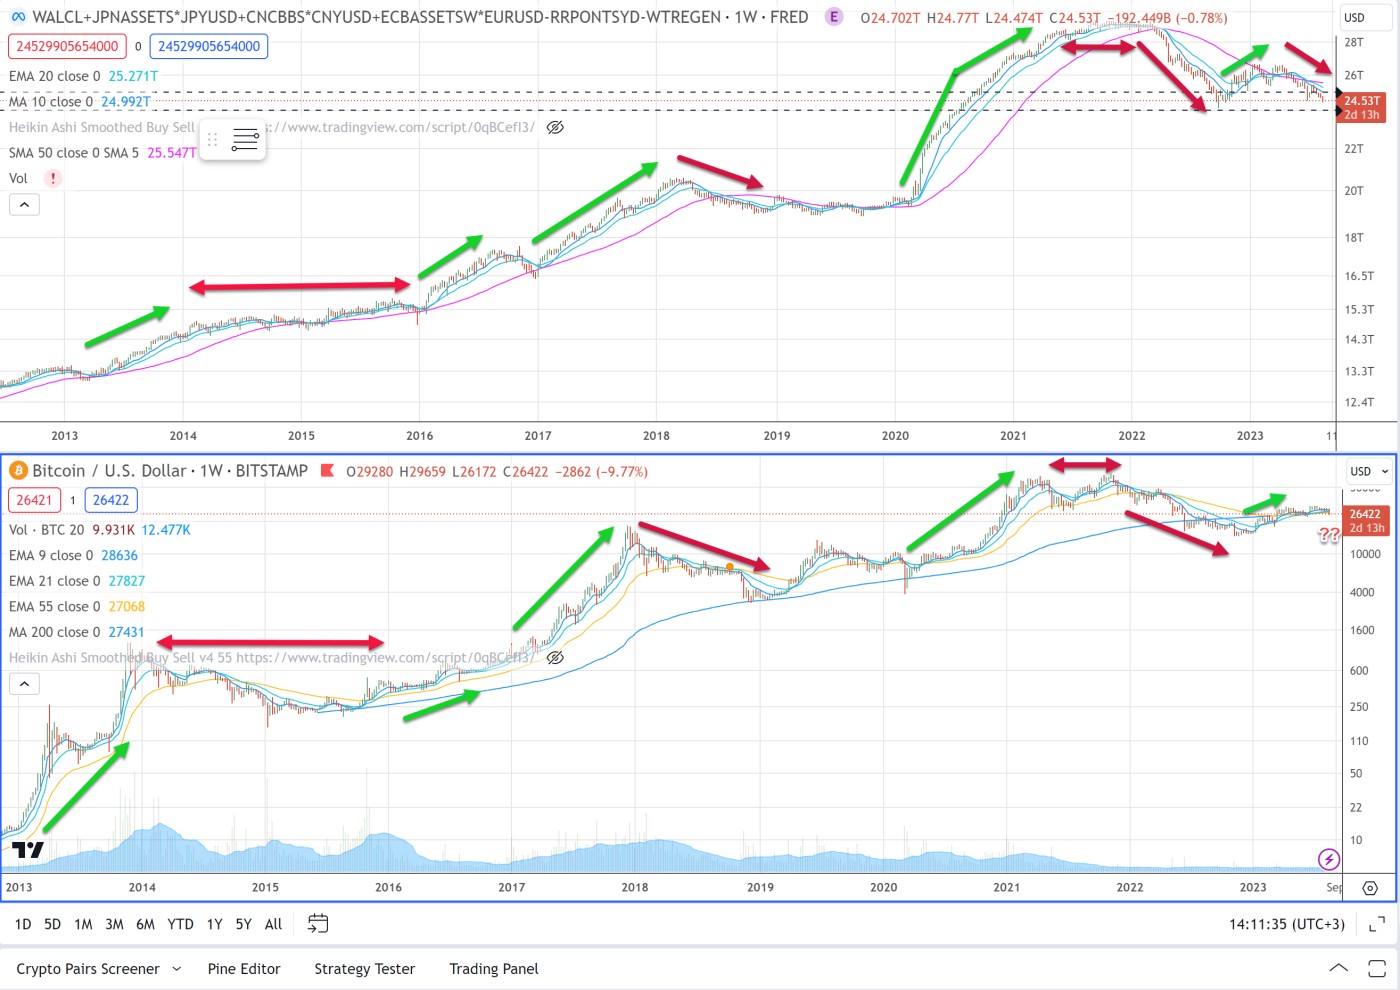
Note how the bullish green arrows and bearish red arrows show how global liquidity correlates heavily with the direction of Bitcoin. The timelines don't quite match up but one can eyeball both charts to see this beautiful correlation.
Bubbles and the beauty of charts
AI-meme stocks which were well overvalued as is standard during bubbles are now susceptible to falling much further given that the bubble is starting to burst. AI wasn't invented overnight though this year's generative AI with ChatGPT and so forth brought immense attention and new utility to the space, thus this year's big rally which then, as with bubbles, got ahead of itself. Still, generative AI-related chip demand remains fierce and underserved. That said, the long term potential of AI still holds true much as with blockchain and dot-coms after their bubbles burst. Obviously the internet continues to thrive.
The beauty of charts is that during bubbles whether dot-com, Bitcoin, or AI among countless others, you can use moving averages to ride the trend as discussed on this website and in our books, then exit once the trend ends. Names that bounce back up into logical areas of resistance can then be shorted.
On timing the market, while going short can be profitable, staying on the sidelines also works to one's benefit as cash is king during sharp selloffs. Shorts pile in which makes the selloffs susceptible to short squeezes. Shorting on such bounces can be prudent. The current downtrend is reversing as a potential dead cat bounce. AI-meme stocks have been a bit oversold, thus the current dead cat bounce makes sense. The model is looking to short into such opportunities.
That said, NVDA reported another blow out quarter 2Q rev $13.51B, est $11.04B; eps $2.70, est $2.09. Sees 3Q rev $16B +/- 2%, est $12.5B. In consequence, NVDA traded up as much as several percentage points after the close. This could push AI-meme stocks higher but for how long? Dead cat bounces can run further than expected especially near major tops as volatility increases. But markets are fighting a backdrop of diminishing global liquidity, long bond yields that are sufficiently high to compete with stocks, and deflated AI expectations due to companies overpromising.
On bond yields, the real yield is the yield on US treasuries minus inflation. The Fed is nearing the end of its hiking cycle but where inflation heads is less certain. If inflation continues to fall, the Fed is still likely to keep rates at current levels for a prolonged period as their 2% mandate is still a ways off. In such a case, the real yield would rise which is bearish for stocks. Powell speaks on Friday so expect him to maintain the 'higher for longer' stance held since late 2021.