
by Dr. Chris Kacher
QEndless
Central banks deal with record levels of debt by monetizing it which artificially suppresses long-term interest rates to avoid a potential collapse of the bond market due to excessive debt issuance. However, this approach comes at the cost of inflation which indicates a relentless upward trend in inflation.
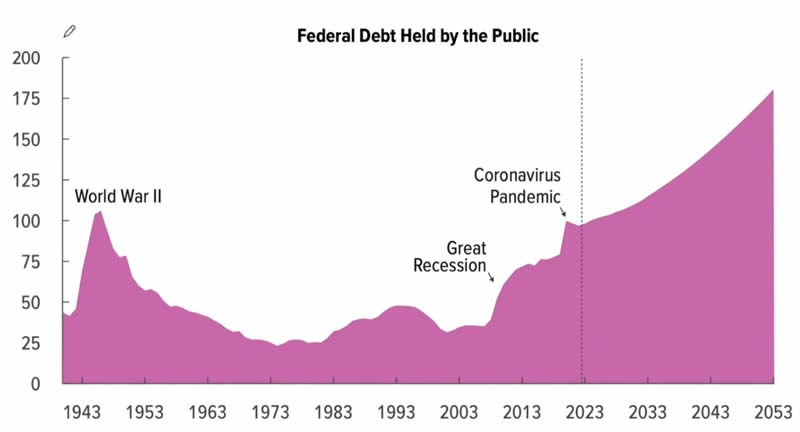
This isn't just a short-term issue; projections suggest it will continue indefinitely. The debt-to-GDP is forecast to rise to 175%, but the actual figure could be much worse, potentially exceeding 200% of GDP. This would lead to a significant devaluation of fiat currencies on a scale we have yet to fully witness. When a country's debt surpasses 100% of GDP, interest payments escalate rapidly, contributing to an ever-growing debt pile. The CBO (Congressional Budget Office) predicts that interest payments will increase from 10% to 23% of total government spending, a scenario that necessitates continuous money printing.
While some European countries and Japan have maintained debt-to-GDP ratios well above 100% for many years, the fiat of these countries is not sovereign. Only the US dollar maintains pole position, so for the leading country to get dragged down by growing debt whose debt-to-GDP well exceeds 100% bodes unwell for all fiat currencies whose overall value will erode at an accelerated pace. This is the first time such has occurred since the US dollar assumed its leading role after World War II. The long term price rise of Bitcoin, real estate, and stocks are direct reflections of this long term trend which is accelerating.For investors, this means that holding cash or cash-like assets such as T-Bills and bonds is not advisable. While central banks may engage in Quantitative Easing (QE) to keep interest rates low, this is a short-term solution. Eventually, inflation will prompt rate hikes to prevent hyperinflation, leading to higher long-term interest rates. The new norm may be 3%, higher than the Fed's current 2% inflation mandate. The expectation is that inflation will come in waves throughout this decade, effectively acting as a stealth tax on workers globally, due to the interconnected nature of the world's financial systems and the tendency of other central banks to follow the Federal Reserve's lead.
QT became stealth QE
The $1.2 trillion of Quantitative Tightening (QT) did not occur at face value. Instead, what has been advertised as QT was more than compensated for by other measures, such as the expansion of the Reverse Repo Market that the Fed engineered to balloon to $2.6 trillion through interest rates manipulation. During 2023, reverse repos were drained by $1.7 trillion to finance US treasury bond purchases. Thus, the QT of $1.2 trillion actually turned out to be net stealth QE of at least $500 billion. Nevertheless, stock, bond, and crypto markets fell appreciably in 2022 due to less QE being pumped into the system. Everything is relative. Had the Reverse Repo Market not been created, markets would likely have crashed. US deficit spending remains out of control, where each peak soon gets passed in a few year's time.
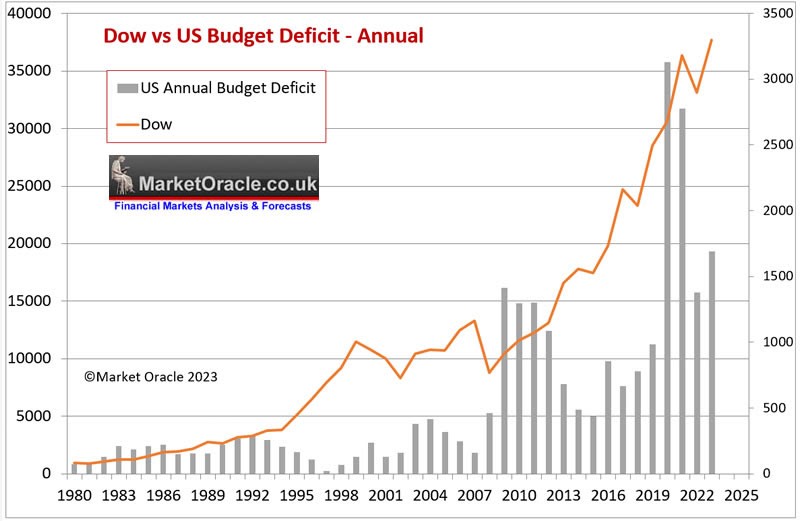
The narrative from Washington suggests efforts to reduce the budget deficit, but the actual situation is quite different. The US government's spending patterns, which primarily focus on consumption rather than investment—including one-time expenditures like wars—mean that the economy relies heavily on continued deficit spending. Curtailing this spending could lead to a significant economic downturn. What is the consequence of such unrestrained money creation? Soaring inflation is the inevitable outcome.
Another reason for QEndlessGlobal real estate woes in the US and China. Commercial real estate is valued at over $20 trillion in the US. With more people working from home, many offices are unoccupied. Of this $20 trillion, about $6 trillion is debt and $14 trillion is equity. Equity value has dropped by about $1.2 trillion which deeply affects pension funds. The US government will have to create fiat via QE to fill in this gaping hole.
Meanwhile, China overbuilt so the vacancy rates are at all-time highs. Years of debt-fueled overbuilding have resulted in almost entirely vacant “ghost cities.” 150 million vacancies in the just residential real estate market alone has been partly worsened by the population drop despite the country's population of 1.4 billion people. This is potentially even more serious than the situation in the US. China's government has been creating fiat via QE to prop up its ailing stock markets due to the real estate ticking time bomb which has clobbered sentiment in the country.
Stock market breadth at worst levels but...
The US stock market major averages are leading by fewer and fewer names. Many think this is ultimately bearish. History, however, shows otherwise. The last three times there was great underperformance by the Russell 2000 vs S&P 500, all markets rallied strongly the following year. Today, we have the largest difference between the S&P 500 being much led by big tech stocks and the rest of the market. Will history repeat? So far, stealth QE and global liquidity suggest markets will be pushed higher. We also have AI productivity where hundreds of millions are now using AI in various forms to optimize productivity.
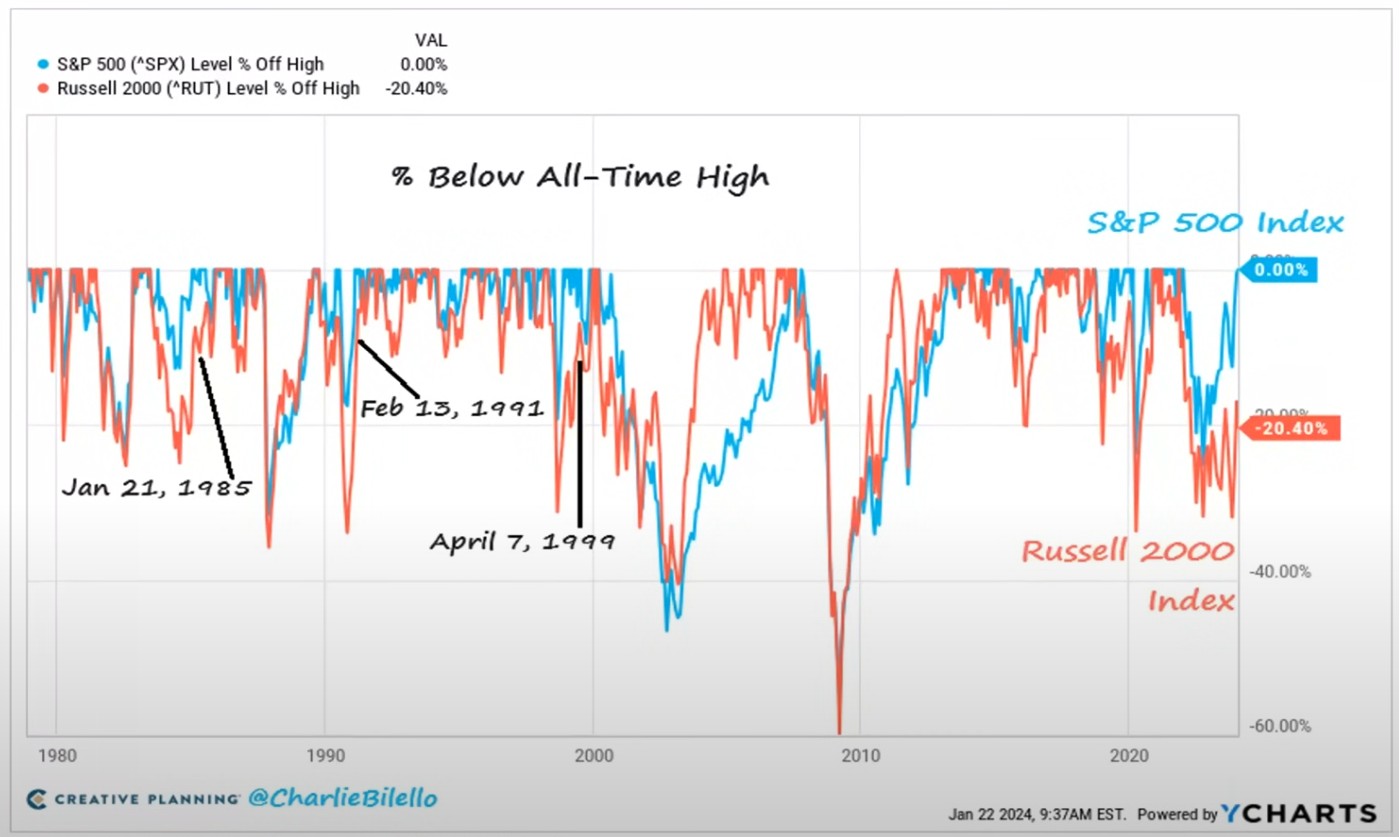
Following the 3 previous largest Russell 2000 drawdowns when the S&P 500 was at a record high, both indicies rallied higher over the following year with the Russell outperforming and joining the S&P at an all-time high:
April 7, 1999 (-19.2% Russell drawdown): The following year, S&P +14.3% and Russell +36.5%
February 13, 1991 (-13.5% Russell drawdown): The following year, S&P +12.1% and Russell +35.5%
January 21, 1985 (-13.3% Russell drawdown): The following year, S&P +17.4% and Russell +18.2%
BTC definitely clears 50k
Q: How long can the ETF's keep adding this much BTC daily? The numbers just don't add up without a crazy supply shock.
A: The amount of Bitcoin being bought in spot Bitcoin ETFs since they were approved earlier this year continues to increase while the amount of GBTC being sold from Grayscale continues to fall.
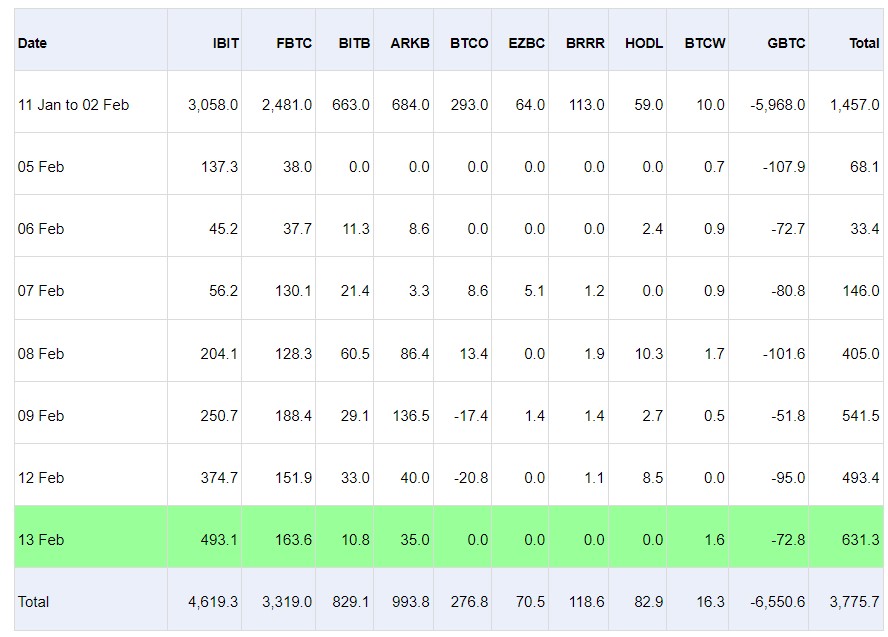 Source: Farside Investors. Note: Data based on a number of sources, including the ETF provider websites and third party financial information providers. The data in the table contains estimates. The data is highly likely to contain errors. Farside Investors is not liable for any errors or inaccuracies in the data.
When Bitcoin is bought through an ETF, the ETF must buy Bitcoin within a day as it is a T+1 settlement. This bodes well for the long term price prospects of Bitcoin. It is akin to the launch of GLD in 2004 when it took a number of months of sideways moves before GLD started into a long term uptrend. But Bitcoin moves much faster so it is already breaking out just a few weeks after its brief downtrend.
Also, compared to the last couple of days, Bitcoin just definitively passed its 50k mark. This is the Livermore century mark rule applied to 10k intervals on BTC. When a stock definitely passes a century mark (every $100), it tends to move higher. This applies to BTC as well when it comes to clearing 10k hurdles. This bodes well for GBTC to which we issued a buy signal a few days ago just before it broke out later the same day on Feb 7. https://virtueofselfishinvesting.com/reports/view/pocket-pivot-review-gbtc