
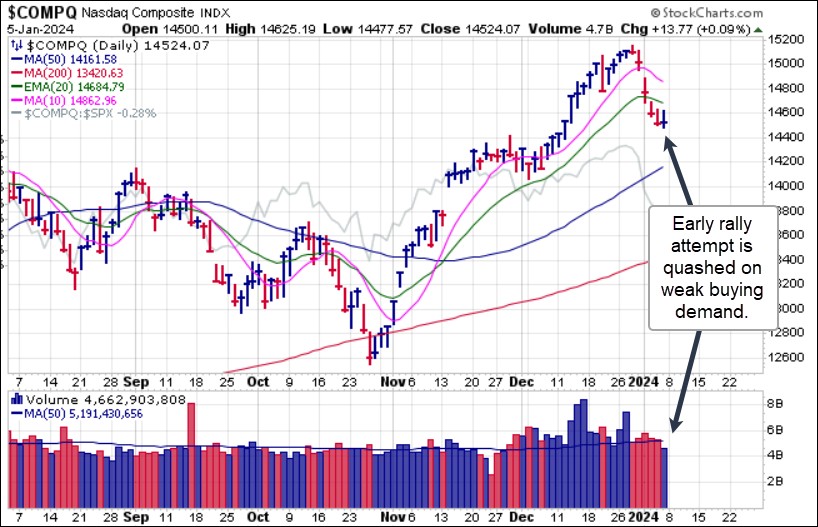
Stocks have started the year off with a three-day sell-off followed by a flat close on Friday as the indexes failed on an early rally attempt following the Bureau of Labor Statistics (BLS) jobs report Friday morning. The numbers came in hot at 216,000 new non-farm payrolls vs. expectations of 162,000. The unemployment rate was expected to tick up to 3.8% but held steady at 3.7%. Futures immediately sold off on the news, but then regained their footing to rally later in the day on Friday, but faltered. The end result was a big bearish churning day as the indexes closed roughly flat after reversing off the early highs.
 Interestingly, active investment managers have rushed out of the market this past week, as Thursday's latest release of the National Association of Active Investment Managers (NAAIM) Exposure Survey showed a very sharp drop in net long exposure from 102.71% last Thursday to 70.95% this past Thursday.
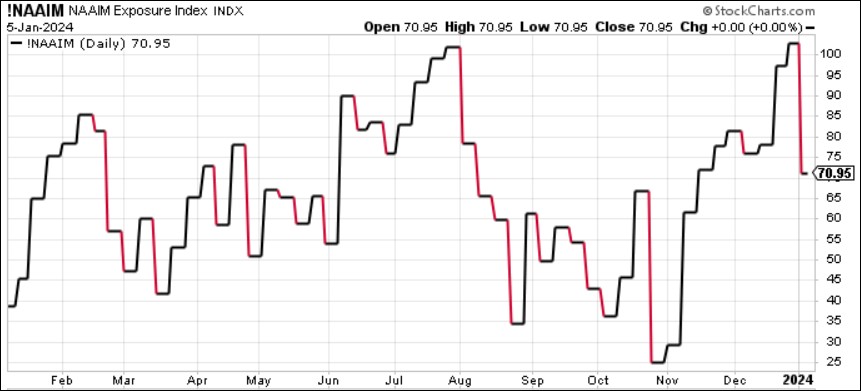 The jobs report was again a wonderful work of fiction. Underneath the surface of various statistical adjustments lies the hard reality, as Gil tweeted on X on Friday, that the Bureau of Labor Statistics also reported that last month the number of full-time jobs plunged by 1.531 million to 1.332 million, the biggest monthly drop since the record crash of 14.7 million jobs at the start of the 2020 pandemic. This may have been why the market attempted to rally early in the day on Friday, with little success.
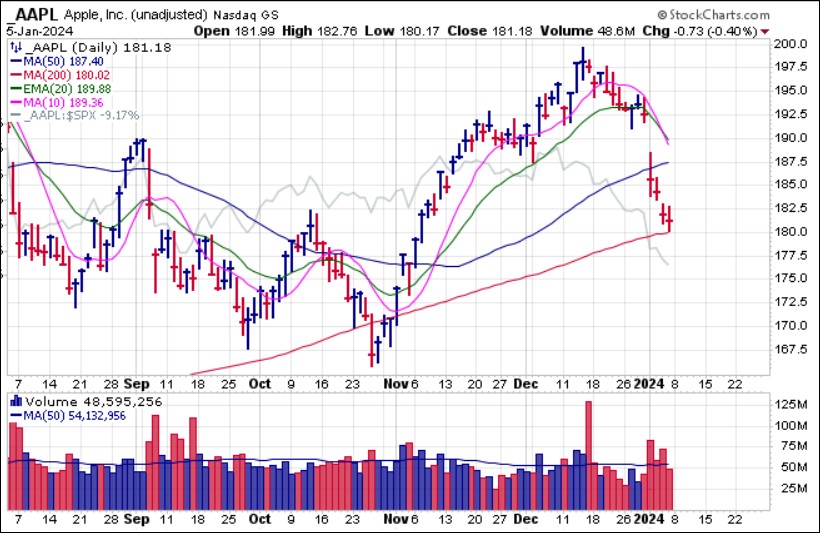
Market bellwether Apple (AAPL) was crushed on Tuesday after an analyst downgraded the stock and called the company's iPhone sales into question. That led to a big-volume gap-down break through the 50-day moving average. By week's end, AAPL was all the way down to the 200-dma, making for an ugly start to 2024 for the big-stock tech juggernaut.
 Amazon.com (AMZN) and Alphabet (GOOGL) both triggered short-sale entries this past week. AMZN triggered a short-sale entry at the 20-dema on Tuesday and Wednesday as its recent base breakout begins to fail. The same goes for GOOGL which triggered a short-sale entry at the 20-dema on Thursday and headed lower from there on Friday. GOOGL also posted a double-top short-sale DTSS entry along the prior left-side peak (dotted line) in its chart the prior week.
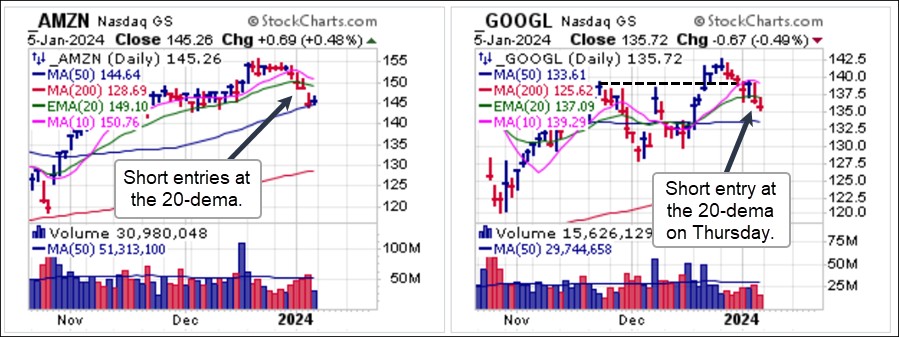 Netflix (NFLX) started the year off with a similar breakdown, and on Friday pushed into 20-dema resistance where it presented a short-sale entry. That would remain the case while one can gain a short-sale entry as close to the 20-dema as possible as the stock remains within short-sale range as of Friday's close. The 20-day line is then used as a covering guide.
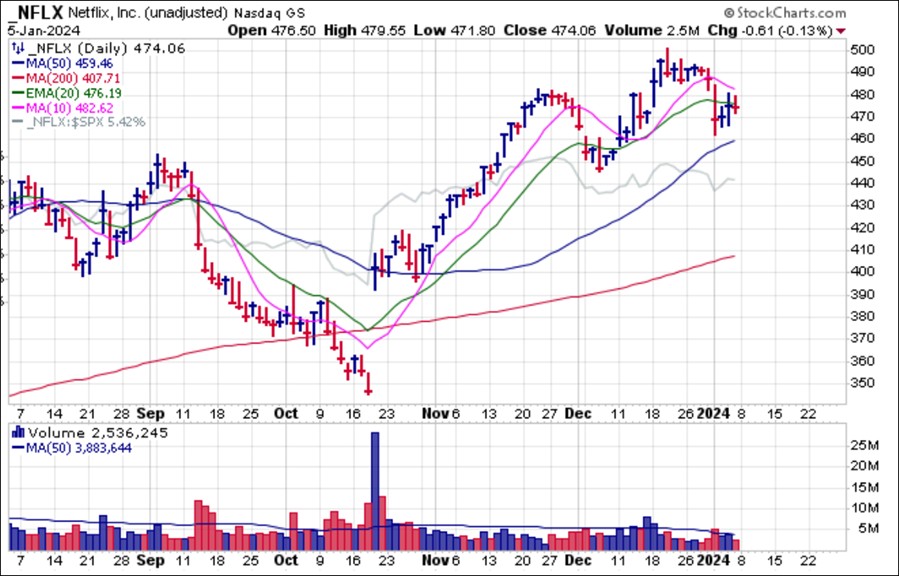
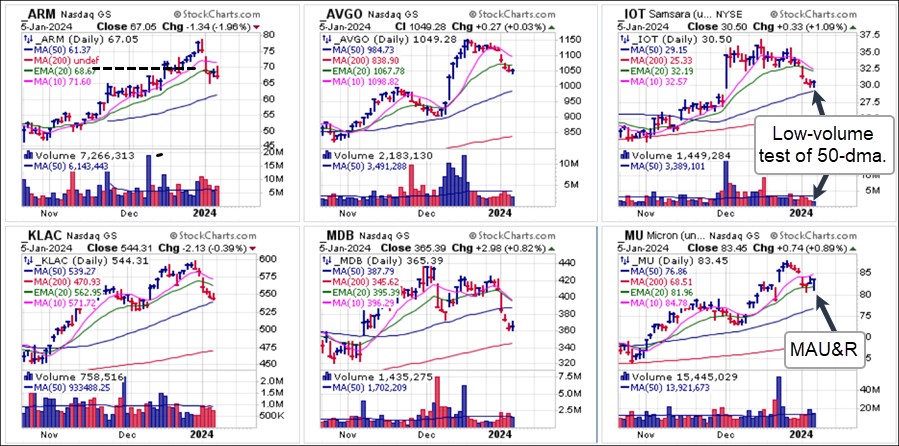
The group charts below give one a strong sense of how broad the breakdown in stocks has been this past week. Arm Holdings (ARM) triggered a double-top short entry at the 69.00 left-side peak in its pattern on Thursday and then again on Friday before reversing back below the 20-dema where a second short entry was triggered on Friday. Broadcom (AVGO), Samsara (IOT), KLA Corp. (KLAC), and MongoDB (MDB) all triggered short-sale entries when they busted their 20-demas on Tuesday and Wednesday. Micron Technology (MU) rolled below its 10-dma on Tuesday but held along 20-dema support to flash a moving average undercut & rally (MAU&R) long entry at the line. The 20-day line would then become a tight selling guide and potential flip-point to the short side if MU fails to hold 20-dema support.
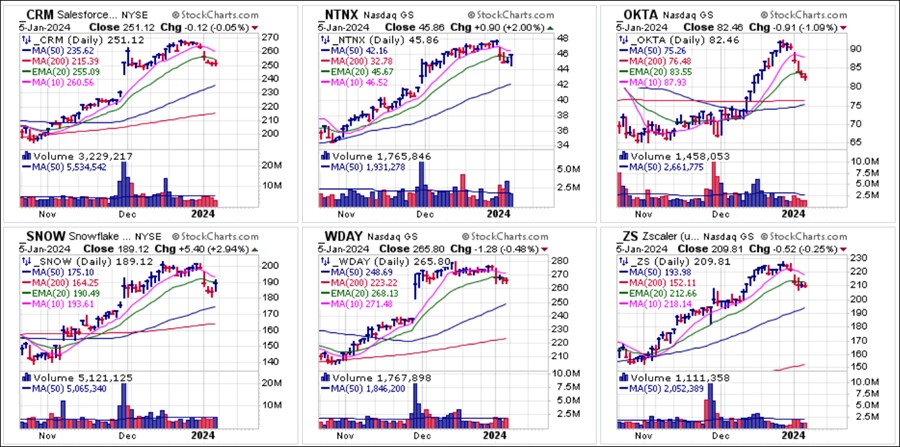
In the second group chart Salesforce.com (CRM), Nutanix (NTNX), Okta (OKTA), Snowflake (SNOW), Workday (WDAY), and ZScaler (ZS) also show sharp breaks to start the week. By Friday's close, CRM, OKTA, SNOW, WDAY, and ZS remained in potential short-sale entry positions just below their 20-demas which would then be used as covering guides. Keep in mind, however, that these are somewhat extended to the downside in the near-term after sharp breaks off the peaks earlier in the week.
 In some cases the selling has been pernicious with some stocks splitting open. Here we see sharp breaks in Analog Devices (ADI), Microchip Technology (MCHP),Mobileye (MBLY), which released exceptionally weak guidance on Thursday morning, NXP Semiconductors (NXPI), Qualcomm (QCOM), Qorvo (QRVO), and Skyworks Solutions (SWKS).
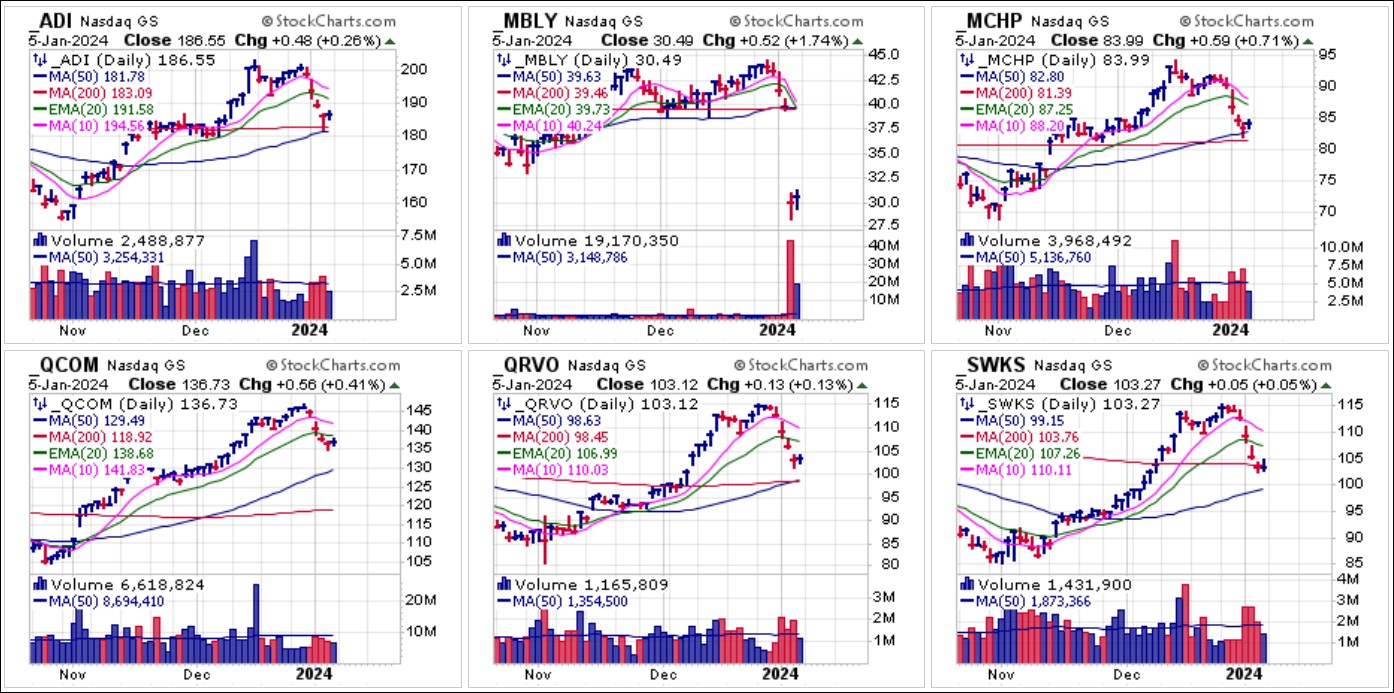 We could go on, but you get the idea - the selling in individual stocks this past week was serious, and may bode badly for the market going forward, at least in the near-term. Certainly, it is clear that the AI Meme Theme is under severe pressure as the weekly chart of the Global X Robotics & Artificial Intelligence ETF (BOTZ) shows a large down week on heavy weekly volume.
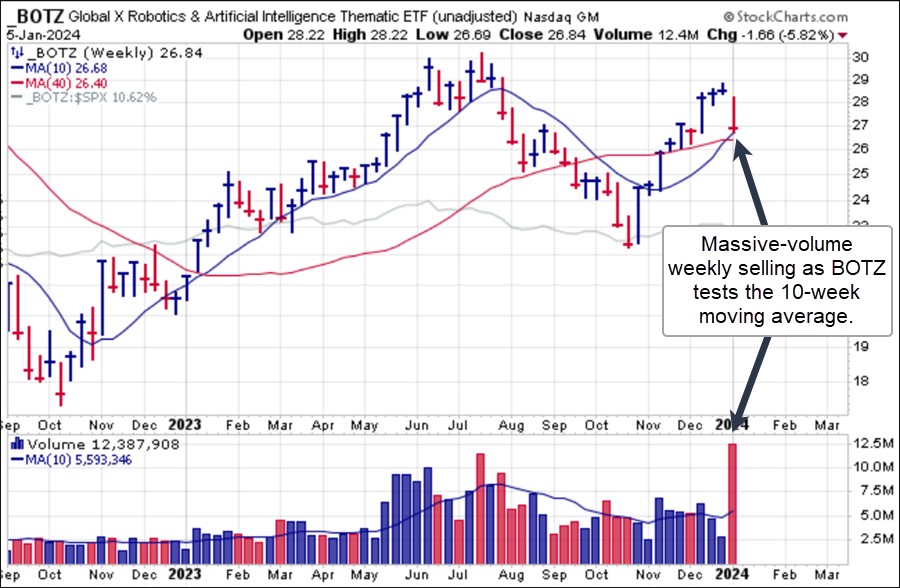 Bitcoin ($BTCUSD) finished the week on Friday by maintaining a constructive chart. It found support at the 10-dma and 20-dema on Friday as it attempts to hold up after Tuesday's failed breakout attempt. We would use the 20-dema as a selling guide per the Seven-Week Rule for $BTCUSD.
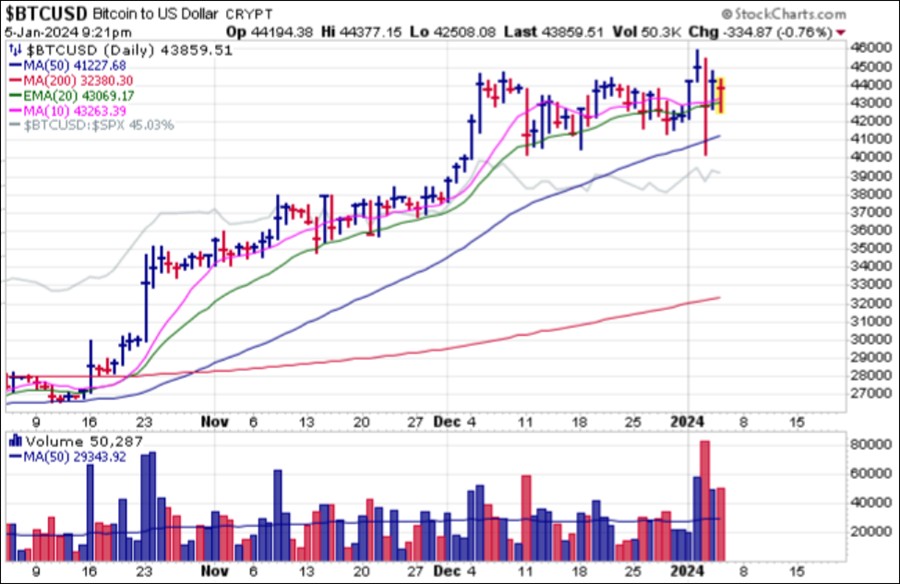 Crypto-related stocks fared less well as many of the strong performers in the space such as CleanSpark (CLSK), Coinbase Holdings (COIN), Robinhood (HOOD), Marathon Digital Holdings (MARA), and Riot Platforms (RIOT) were all hit with heavy selling off the peak two Fridays ago to end the 2023 trading year and then again on Tuesday to start off the 2024 trading year. MSTR is holding up relatively better as it remains above its 10-dma.
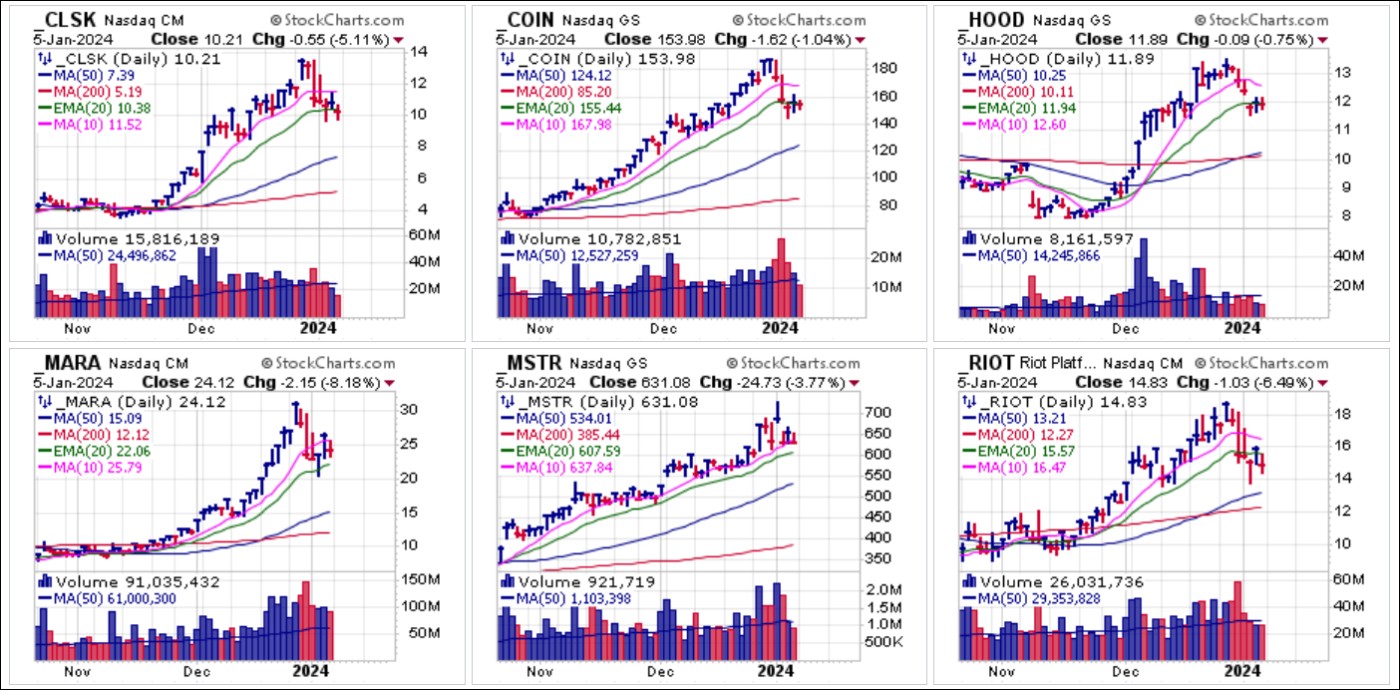 The Market Direction Model (MDM) remains on a BUY signal.