
Current Focus List

The VoSI Focus List is a compilation and reference list of stocks for which Pocket Pivot or Buyable Gap-Up Reports have been issued and which have been deemed suitable for inclusion on the Focus List. Not all stocks for which a Pocket Pivot or Buyable Gap-Up report has been issued will necessarily be added to the list. It is not intended as a "buy list" or a list of immediately actionable recommendations. Stocks on the list may or may not be in proper buy positions, and investors should exercise discretion and proper judgement in determining when and where stocks on the Focus List can be purchased. The following notes are intended to assist in this process. Please note that members can enlarge the Focus List image by clicking on the body of the email and then holding the Control Key while pressing the "+" key until it is large enough to read.
General Observations:
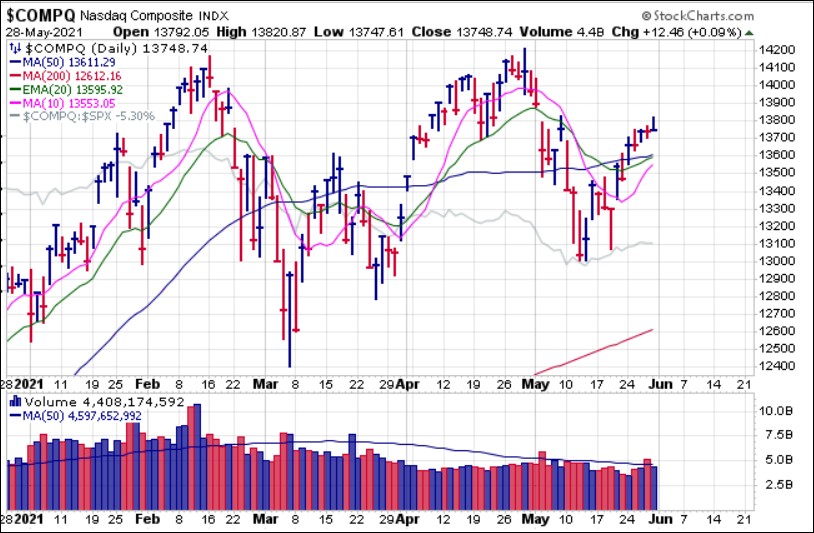
The NASDAQ Composite Index remains in a wide, choppy range extending back to February. While it was able to regain the 50-day moving average this past week, note that the 50-day line has not served as a reliable reference for support or resistance, adding to the chaotic nature of its chart pattern. On Friday, the index stalled and reversed off the intraday highs on weak volume, but is still the highest upside volume seen all week after Thursday’s volume spike as a result of MSCI Index rebalancing. For now this remains a trend less environment.
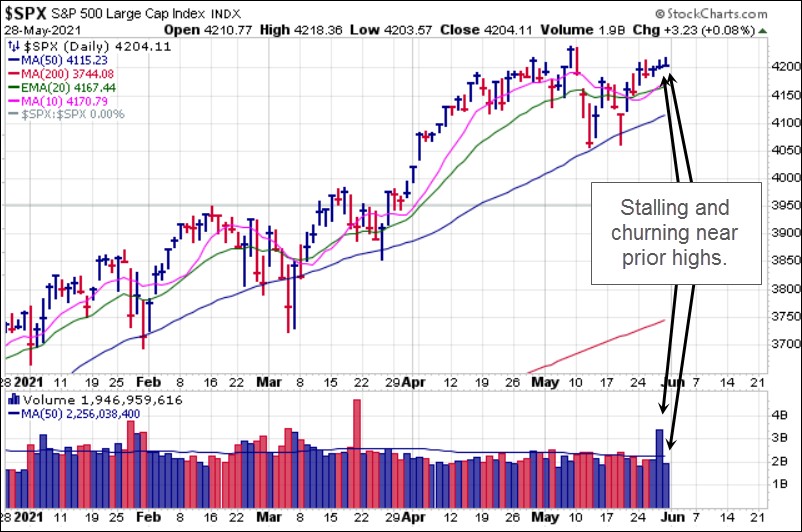
The S&P 500 Index also displays a mostly trend less look to its chart as it remains in a choppy range. It is now testing its prior highs above 4200 which remains a significant resistance level. Over the past two days the index has churned and stalled along the 4200 level on heavy index rebalancing volume on Thursday and lighter volume on Friday.
The Market Direction Model (MDM) remains on a CASH signal.
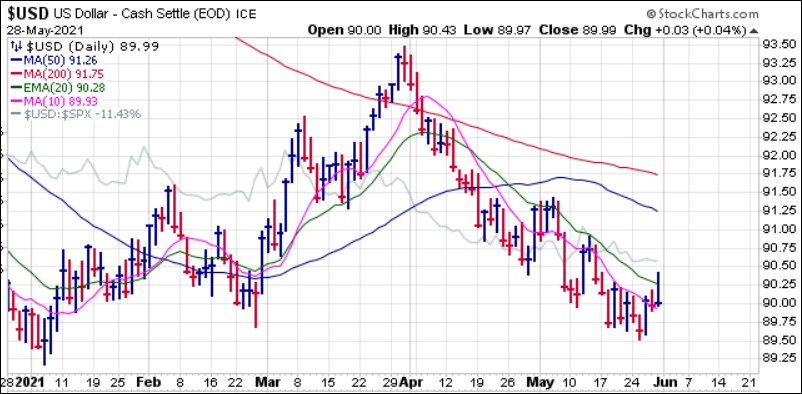
The U.S. Dollar remains in a persistent two-month downtrend, which is theoretically bullish for stocks, but the steady downtrend has not triggered decisive moves to new highs in the major market indexes.
The 10-Year Treasury Yield ($TNX) continues to consolidate after a sharp run-up earlier in the year. We continue to monitor this as we believe the potential for higher rates to come is growing, and of course this will first show up as a breakout in Treasury yields. So far, the $TNX is merely consolidating the prior sharp run-up which was likely discounting the recent spikes in Consumer and Producer Price Index data reported earlier in May. On Friday, the Fed’s favorite inflation indicator, the CPI, came in at a year-over-year rate of 3.6%, the highest since 2008.
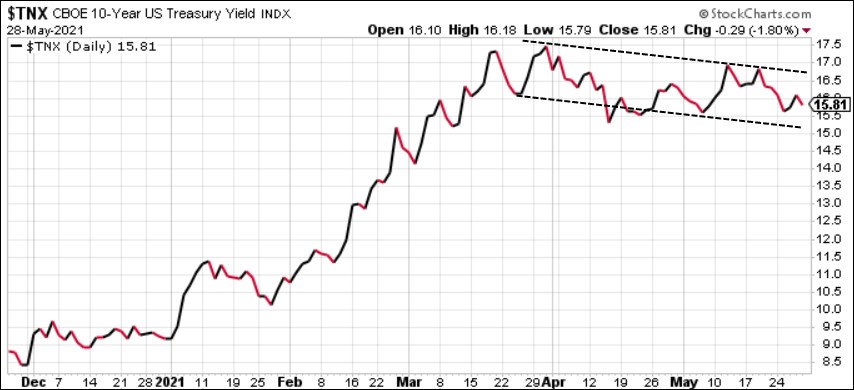
If inflation increases persist across a broad spectrum of relevant data, rates could break higher. That said, Fed Fund futures tend to overestimate future inflation by an average of 54 bps than actual rates a year out while the effective funds rate remained near zero. With $6 trillion in spending packages on the way, rates should stay near record lows for the foreseeable future. Should the Fed try to tighten their balance sheet, a repeat of prior instances of this over the last decade are likely wherein the stock market suffers sharp corrections of typically around -20% before the Fed once again steps in and calms the market by reversing their hawkish stance.

As crypto-currencies rapidly lose favor amid precipitous declines in May, precious metals have continued to shine.The Sprott Physical Gold Trust (PHYS) has been up seven days in a row and finished the week at its highest levels since early January. Note that the move in gold inversely correlates to the dollar decline over the past two months.
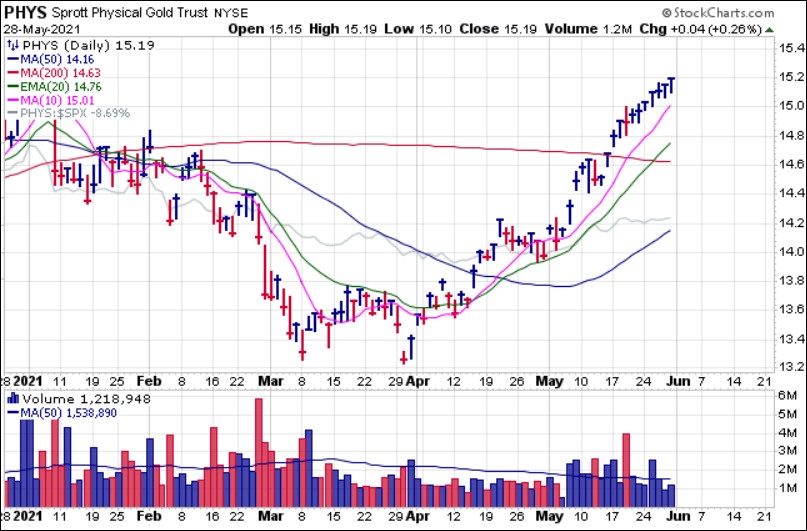
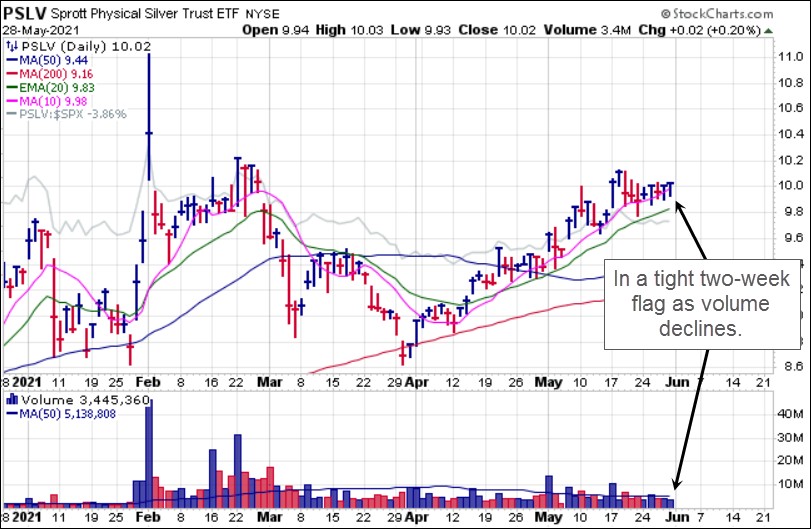
The Sprott Physical Silver Trust (PSLV) is meanwhile holding tight along its 10-dma and 20-dema as it builds a short flag formation that also forms the hand of a larger cup-with-handle pattern. This is in a buyable position using the 20-dema as a maximum selling guide. Both the PSLV and the PHYS were buyable on the basis of undercut & rally long set-ups along their March lows as discussed in prior reports, and the upside trends have held steady since then.
This remains a mostly choppy and trendless environment that in our view offers little in the way of sustainable trend-following opportunities. Until the environment changes, we expect that the Focus List will remain mostly unpopulated. When there is little to do, it is best to do little.