
Current Focus List
There are currently no names on the Focus List
The VoSI Focus List is a compilation and reference list of stocks for which Pocket Pivot or Buyable Gap-Up Reports have been issued and which have been deemed suitable for inclusion on the Focus List. Not all stocks for which a Pocket Pivot or Buyable Gap-Up report has been issued will necessarily be added to the list. It is not intended as a "buy list" or a list of immediately actionable recommendations. Stocks on the list may or may not be in proper buy positions, and investors should exercise discretion and proper judgement in determining when and where stocks on the Focus List can be purchased. The following notes are intended to assist in this process. Please note that members can enlarge the Focus List image by clicking on the body of the email and then holding the Control Key while pressing the "+" key until it is large enough to read.
General Observations:
We find ourselves in the interesting position of having no Focus List to review. As we wrote last week, the fact that we were unable to find stocks that qualified for the list even as the general market was making all-time highs late in September was a clue regarding the underlying state of the market at that time. And over the past two weeks we have seen the consequences of the paradoxical phenomenon. Now, after AMZN, FTNT, and SQ, have split wide open over the past two weeks and were subsequently removed from the list, we still see absolutely nothing that comes even close to qualifying for inclusion on the Focus List. This is a stark, but clear, indication of how weak this market is "under the hood."
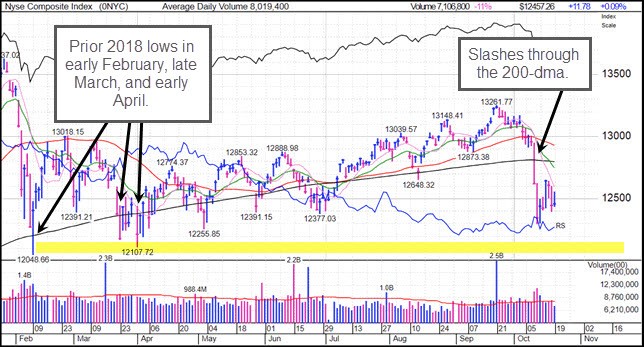
The daily chart of the NYSE Composite Index, a very broad index of more than 1,900 stocks, show how badly the broader market has deteriorated over the past month. After slashing through the 200-dma nearly two weeks ago, the NYSE Composite, which had not even come close to surpassing its January 2018 all-time high on this latest choppy rally off the early 2018 lows, is now testing those prior 2018 lows.
The Market Direction Model (MDM) remains on a cash signal.
The Short-Side:
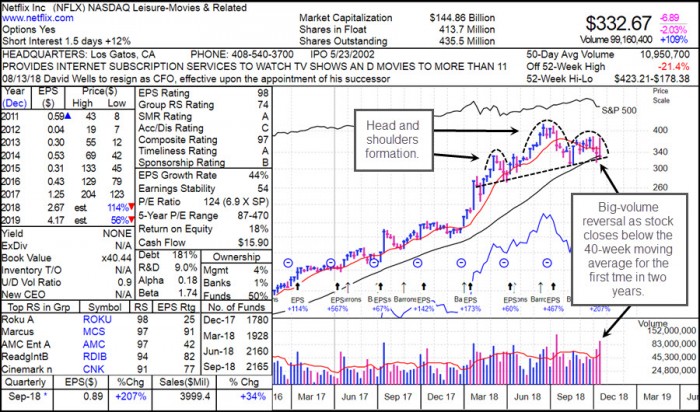
Thematic short-sale set-ups have been hard to come by in this market. Every sell-off in 2018 has seen the market quickly find its feet and turn back to the upside. This has relegated the short-side to mostly tactical short-sale set-ups of very short duration, which we have covered in our live webinars. Netflix (NFLX) may be setting up for something more than a short-term tactical short-sale set-up as it forms a complete head and shoulders pattern and closes below its 40-week moving average for the first time in over two years. The stock is also sitting right at the neckline of this H&S formation, with the possibility of a breakout to the downside looming.
While NFLX has closed just below the 40-week line on the weekly chart, it is still holding just above the 200-dma on the daily chart, below. Thus, we might look for a bounce off the 200-dma that would set up a more optimal short-sale entry closer to the 50-dma, or the 10-dma and 20-dema, both of which have now moved below the 50-dma. NFLX is currently 2.6% below the 10-dma, 5.2% below the 20-dema, and 6% below the 50-dma. Any move back up towards those three moving averages would set up a more optimal short-sale entry with the idea of using the 50-dma as an upside stop.
Conversely, if the stock busts the 200-dma this coming week then that would trigger a short-sale entry at that point, using the 200-dma as an upside stop. We would then look for confirmation of this breakout to the downside by also seeing the stock break below the H&S neckline. This is how the "classic" H&S short-sale set-up would work. How well this works will no doubt depend on where the general market goes from here, and whether we are in the midst of a longer-term market top, or at least a deeper correction.
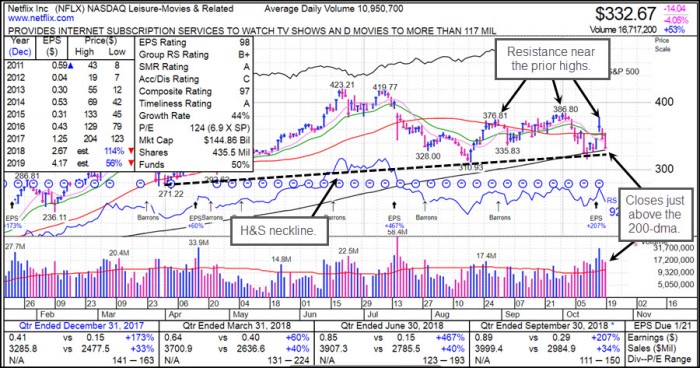
Note that NFLX ran into resistance after gapping up on its earnings report right near the prior August and September highs. These look like two smaller right shoulders that don't show up on the weekly chart, and the post-earnings gap-up move looks like the third. As we progress through earnings season, we need to be aware of the fact that many formerly leading stocks have broken down from their peaks, and gap-ups within busted patterns following earnings could set up potential short-sale opportunities.
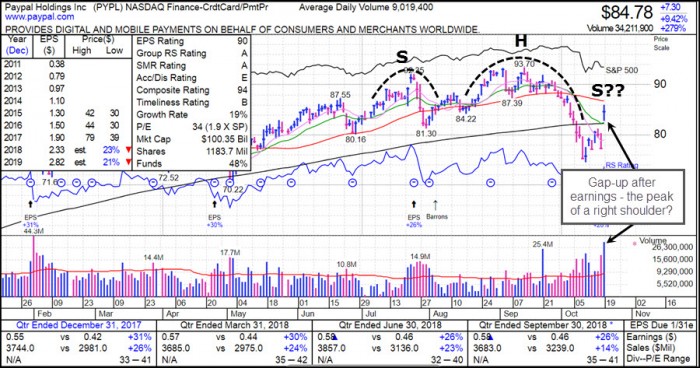
PayPal (PYPL) is one example of a post-earnings gap-up within a busted pattern. The initial break off the peak in early October created the right side of the head in a possible head and shoulders formation. This latest gap-up following earnings could set up a right shoulder in the pattern. Resistance near the 50-dma could also set up an early short-sale entry, before any right shoulder is completed. Based on what we've seen so far, and during this past week as earnings season just gets started, we think we may see more of these types of set-ups emerge where the peak of a right shoulder in a busted pattern offers an early short-sale entry point. Therefore, as we move through earnings season, members should review their old long watch lists for busted patterns among former leaders that may be in similar positions, and be ready to act on any possible post-earnings gap-ups that stall out or fail outright.
The short side of this market has been almost entirely a short-term tactical affair in 2018. But what we're currently seeing on the weekly charts looks qualitatively different after this recent market peak, and may indicate that intermediate- to longer-term, thematic short-sale opportunities may become more common. Certainly, the weekly chart of NFLX shows a change of character in the stock that we haven't seen for some time, and that may be meaningful. Stay tuned.