
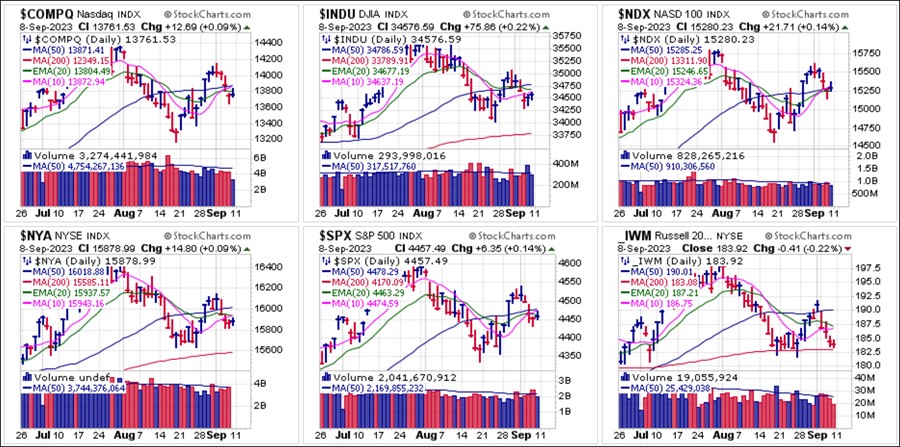
Major market indexes spent the week in lower low territory after breaking below the 50-day moving averages at various points throughout the week, depending on the index in question. The broader market, as represented by the 2700-stock NYSE Composite and the small-cap Russell 2000 via the daily chart of the ProShares Russell 200 (IWM) ETF, remains weak as both indexes underperform their marquee brethren. This week will see important inflation data with the Consumer Price Index (CPI) due out Wednesday before the open followed by the Producer Price Index (PPI) before the open on Thursday.
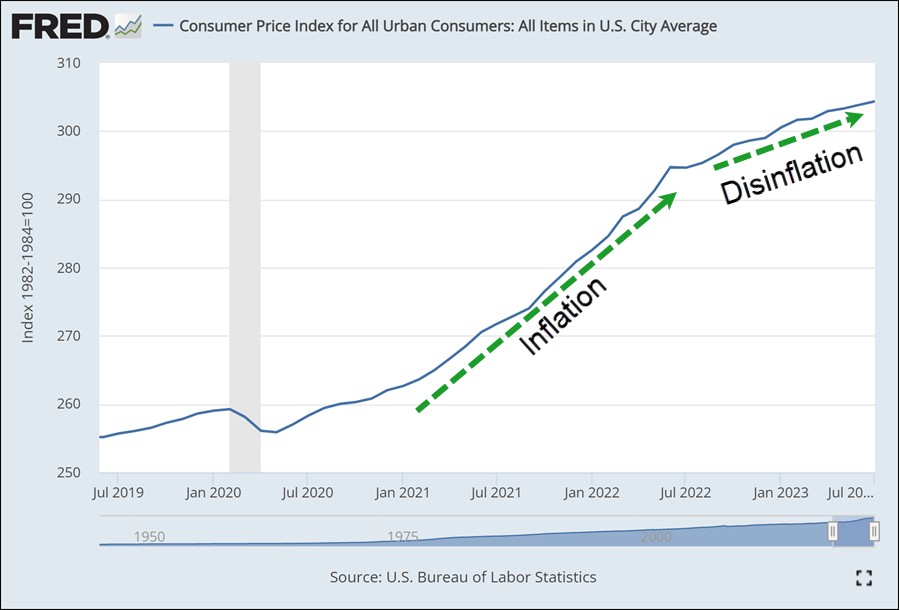
 These numbers have the potential to move the market as they will either confirm or negate the current soft landing consensus as the economy weakens and inflation allegedly subsides. The gimmickry of disinflation, a term thrown around by Fedheads and politicians to foster the illusion that inflation is reversing, is laid bare by the absolute CPI Index chart, below. As it shows, price levels remain elevated and continue to rise, albeit at a slower pace than we saw from mid-2021 into mid-2022.
That is what is advertised as disinflation, but from the looks of this chart, absolute price levels look to us like they are forming an ascending base of sorts. Are they ready to break out? All we know for certain is that we will find out this coming Wednesday and Thursday.
 During Wednesday's live VoSI Market Webinar Gil covered several big-stock AI Meme leaders that were in short-sale positions in real-time, and we later sent out reports on several short-sale target stocks. Most of these have broken lower since Wednesday.
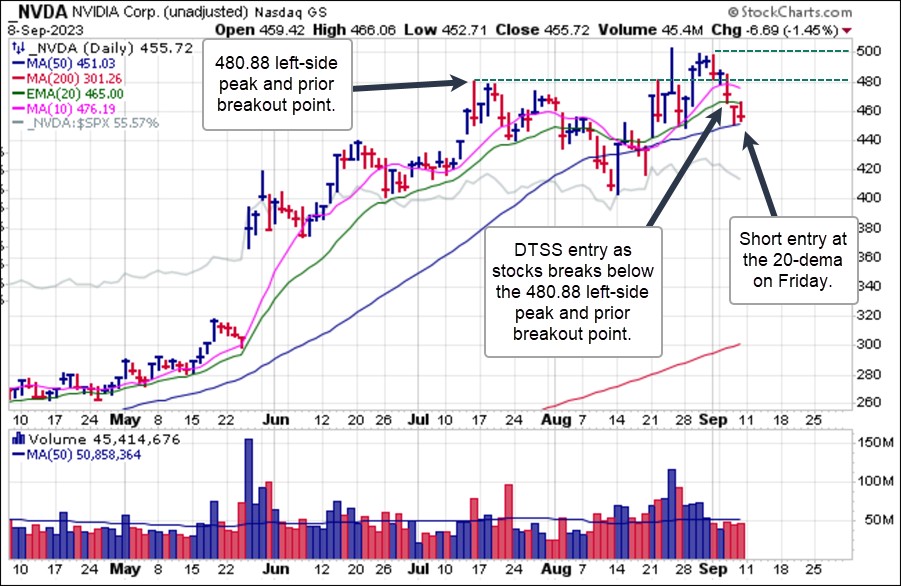
Starting with Nvidia (NVDA), we see that it triggered a double-top short-sale (DTSS) entry at the 480.88 left-side peak and prior breakout point in its pattern on Wednesday. It then went on to gap below the 20-dema on Thursday to trigger a second short-sale entry before finding support at the 50-dma.
On Friday it rallied back up into the 20-dema which brought it right back into short-sale range at the line and reversed to close near the 50-day line. In this position, rallies back up into the 20-dema would bring NVDA back into short-sale range while any break below the 50-day moving average would trigger a fresh short-sale entry so both can be watched for.
 Broadcom (AVGO) triggered a short-sale entry along its 50-dma on Wednesday and the gapped lower on Thursday. It is now dangling below its 20-dema and the slightly higher 50-dma. In our view, it would preferable to see a rally back up closer to the 20-dema or even the 50-dma which would bring AVGO back into better short-sale range from here.
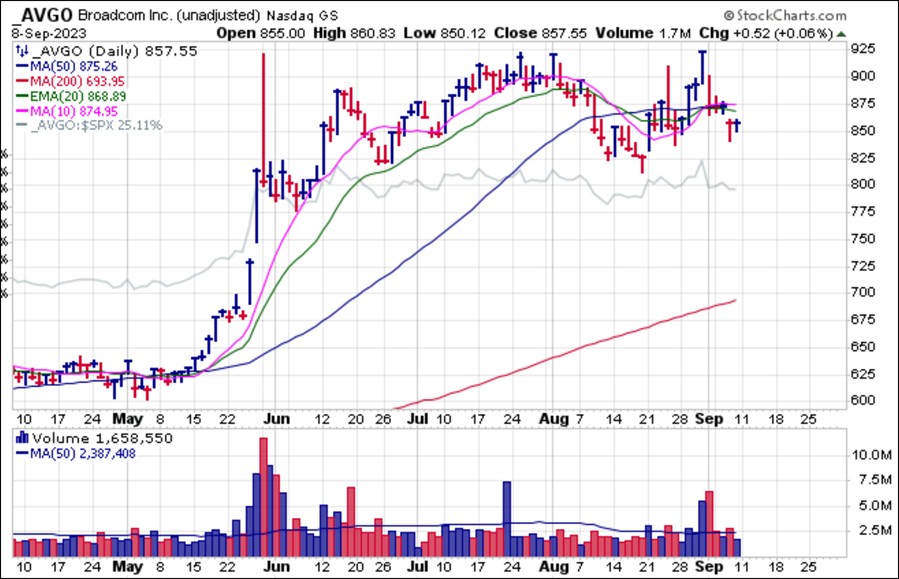 Rambus (RMBS) was in a short-sale entry position just below its 50-dma on Wednesday and it has since move higher, closing just below the 20-dema on Friday. That technically triggers a second short-sale entry but we would prefer to see a rally back up closer to the 50-day line as a more optimal short-sale entry if we can get it, although nimble traders can short it here below the 20-dema and then use the line as a covering guide.
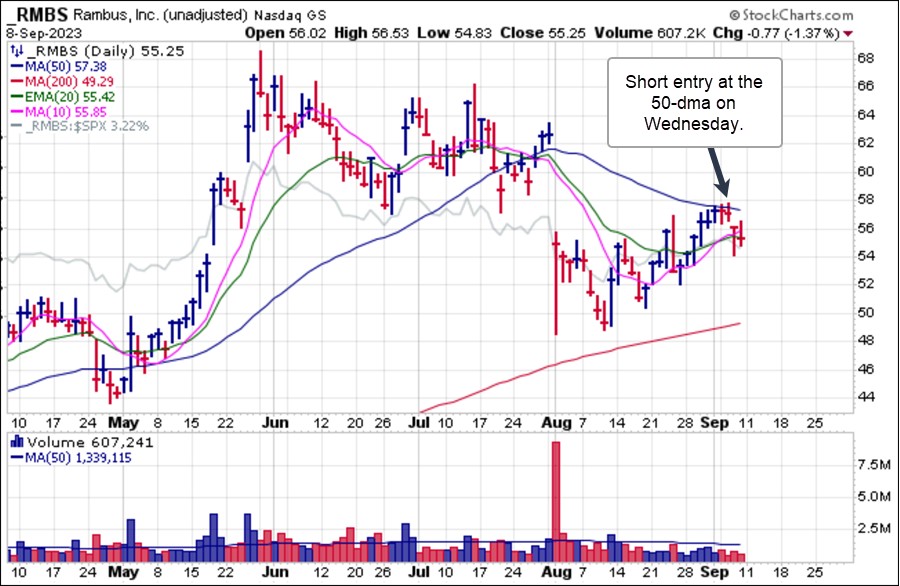 Advanced Micro Devices (AMD) was a short entry at the 50-dma on Wednesday before it broke lower on Thursday. On Friday it rallied back up near the 50-day line which brought it back into short-sale range. It then reversed near the line and broke below the 20-dema to trigger another short-sale entry on the same day. We continue to view rallies back up into the 50-dma as the most desirable short-sale entries if we can get them.
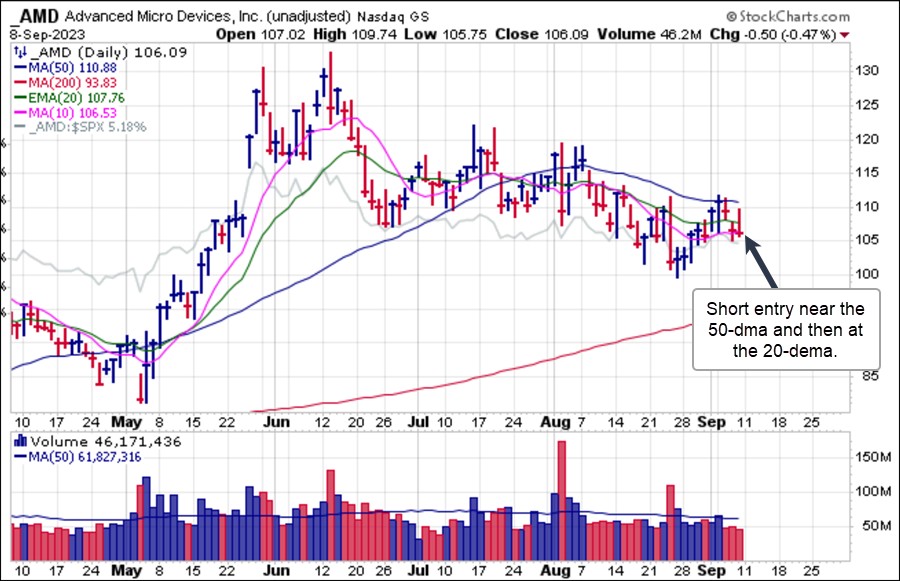 Fortinet (FTNT) was in a short-sale entry position on Wednesday but quickly moved above the line, quickly stopping out any short position taking at the line. The stock was arguably quite oversold so the odds of a rally from current deep, down and dirty levels is likely higher than it would be for stocks just breaking down from or rallying up into moving average resistance up higher in their charts. At this stage any reversal back below the 200-dma would trigger a short-sale entry from here so can be watched for after FTNT closed Friday 3% above the 200-day line.
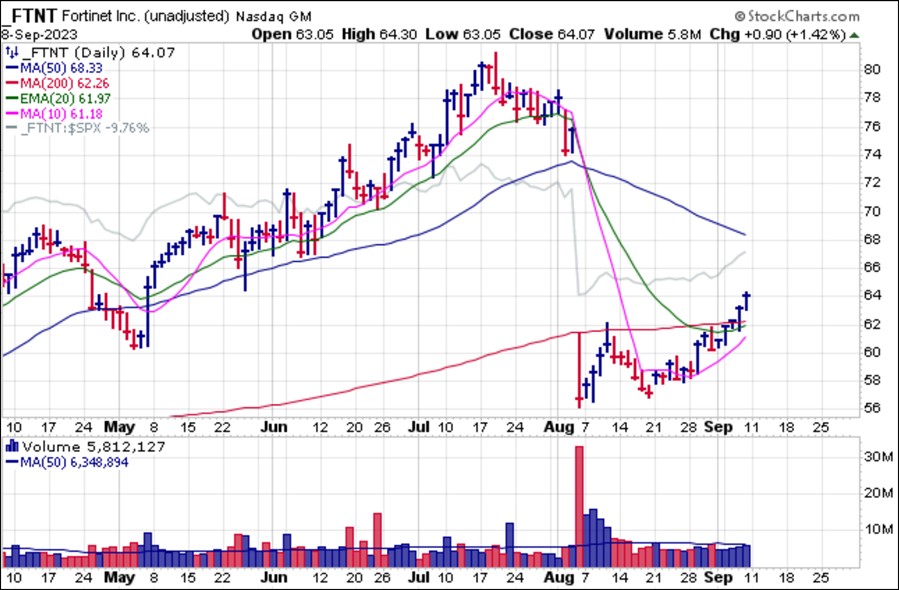 Marvell Technology (MRVL) was a short on Wednesday at 20-dema resistance before it headed lower from there. In this position rallies back up into the 20-dema would bring MRVL back into short-sale range so can be watched for.
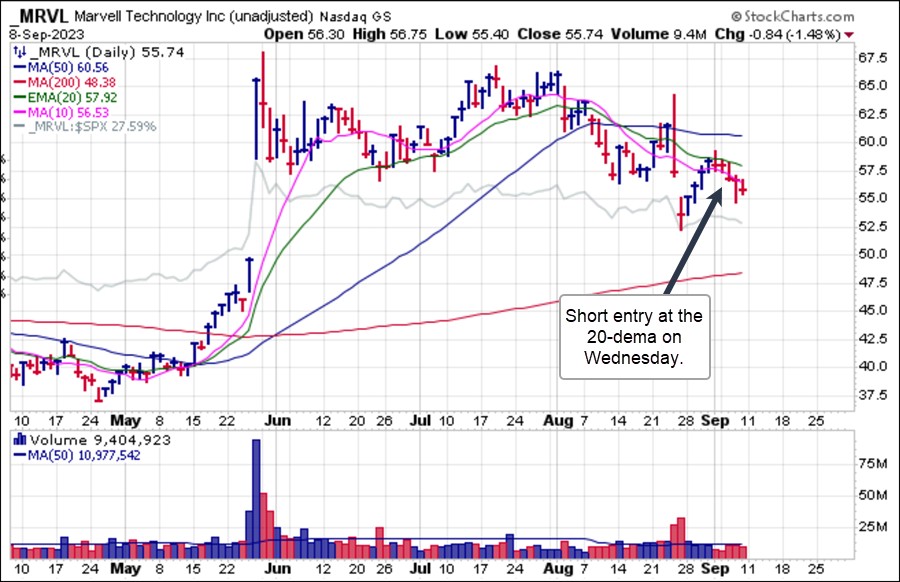 Meta Platforms (META) has spent the past week pirouetting around its 50-day moving average, reversing three times in a row along the 50-day line before closing below it on Friday. That puts the stock in a short-sale entry position using the 50-dma or the Friday high at around 305.25, about 2% away from Friday's close, as a covering guide.
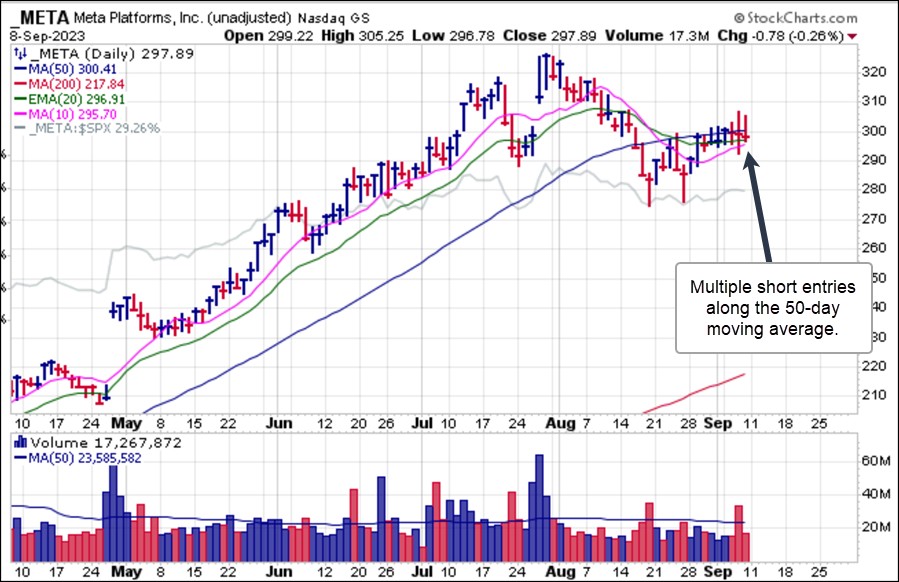 MongoDB (MDB) triggered a short-sale entry at its 50-dma on Wednesday and then broke down to the 10-dma and 20-dema where it held support at the end of the week. In this position rallies back up into the 50-dma would bring MDB back into short-sale position so can be watched for. Meanwhile any decisive break below the 10-dma/20-dema confluence would trigger fresh short-sale entries at that point so can also be watched for.
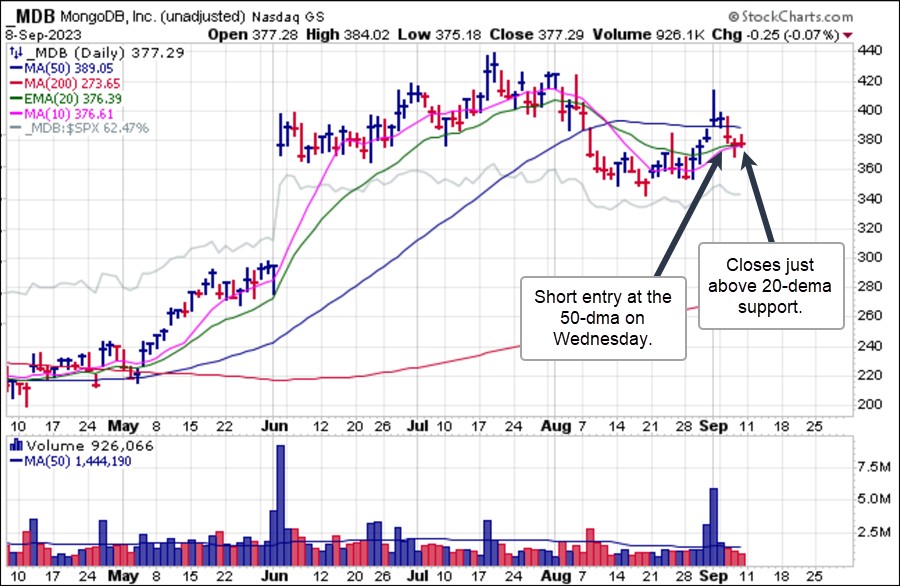 The Grayscale Bitcoin Trust (GBTC) failed on a breakout attempt nearly two weeks ago and broke hard late last week. This past week it has wedged back above the 50-day moving average on very weak volume, setting up a possible short-sale entry trigger if it reverses back below the 50-dma, which can be watched for this week. If attempting to short GBTC, one alternative strategy is to go long the ProShares Short Bitcoin Strategy (BITI) ETF as a vehicle for the trade at the same time that GBTC potentially breaks below its 50-day moving average.
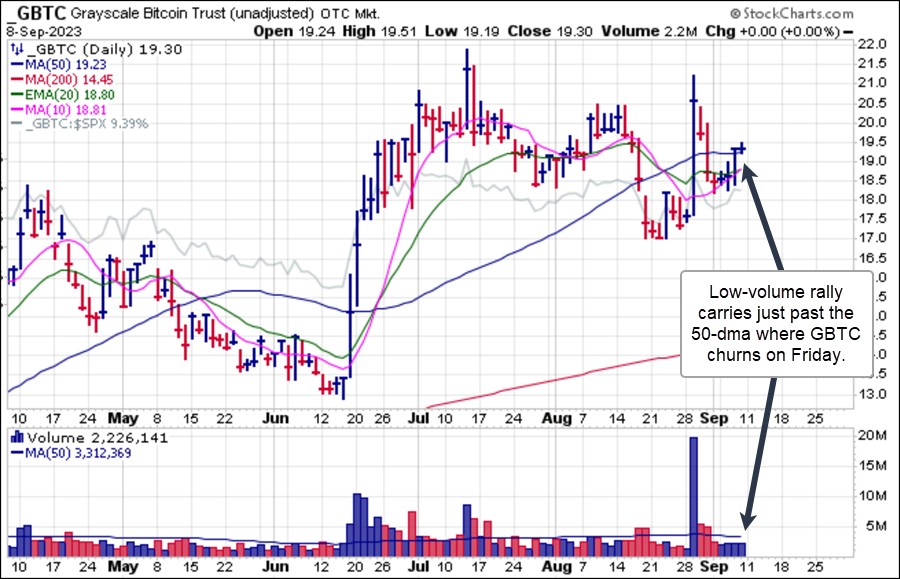
The Market Direction Model (MDM) remains on a SELL signal.