
FAQs Frequently Asked Questions
Q: The Shanghai Index looks very similar to the NASDAQ in 1999 from what I see.
Please take a look at this chart:
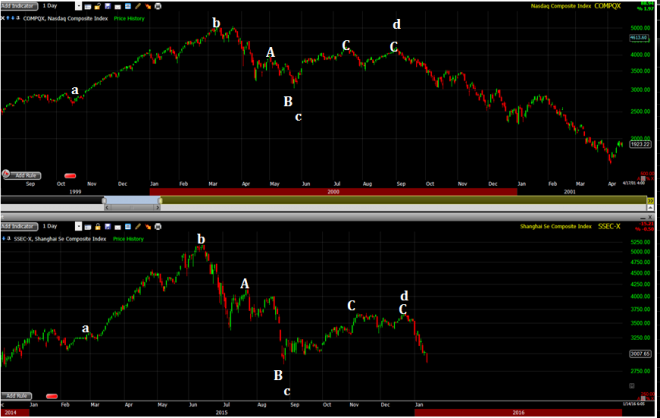
In the top pane I have plotted the NASDAQ Composite Index during its 1999 .Com bubble and only the beginning of the collapse that followed as the Index went on to lose 77% of its value before it bottomed in 2003. In the bottom pane I have the Shanghai Composite Index during its 2014-2015 rocket like move and the initial collapse that has followed since it peaked middle of last year.
I am sure even the most novice chart reader can spot the similarities between these two indices. As you can see after a rocket like move and a blow off top they both ran into a brick wall and suddenly reversed course sharply. After the initial break they both were able to put in a rally that was short lived (Point A) as the vicious selling resumed and took the indices to new lows (Point B). Both indices then were able to rally for the next three to four months (Point C) before the selling caused them to breakdown again. You can also notice they both had similar shakeouts between the two C’s.
Of course it would be impossible to predict the future but if the past behavior of our financial markets is anything we can learn from then given the current problem facing the Chinese economy I will not be surprised in any way to see the index bleed for the next six to twelve month if not longer trading all the way back down to the 2000 levels.
The other thing that’s worth noting here is that it is amazing to see how similar so far the duration of each move in these two indices have been. Point (a) to (b) took between 4 to 5 months, point (b) to (c) took a little less than 3 months and point (c) to (d) took little over 3 months for the NASDAQ while it took almost 4 months on the Shanghai Composite Index.
A: My first question would be how, exactly, can this be used to make money? Does one simply short everything and sit tight, satisfied that the market is going to follow the path of a prior market period in history (and in a different market in a much different, communist country) just because it looks similar? Obviously, that would be an absurd position to take, as one must still adhere to stops and profit objectives.
Therefore my general view of this type of analysis (and I admit that I've tried to do it in the past, but have since abandoned the temptation to make such comparisons) is that while it is a nice intellectual exercise, it does not really add anything to the direct process of making money in individual stocks, long or short.
I would also point out that, at least in my experience, just because the action of an index from the past might look similar to the action of an index today, it generally does not work out as some sort of "road map" for what is going to happen to the index of the present. I can remember many analysts and pundits making comparisons of the NASDAQ in 2008 to the Nikkei in the 1980's, and while the two looked similar at the time, the NASDAQ action in 2009 and beyond did not continue to follow the Nikkei action in the 1980's.
To me the NASDAQ of 2000 looks more like the Chinese markets in 2007, since both had parabolic upside moves before they topped. To compare the Chinese markets in 2016 to the NASDAQ in 2000 ignores the fact that the Chinese market only recently broke out in March of 2015 from of a long six-year price range it had been forming since 2007, whereas the NASDAQ in 2000 was in a big parabolic move throughout the 1990's which strikes me as more similar to the big parabolic move the Chinese markets had up to late 2007.
As I've gained experience over 25-plus years of trading, I have come to the conclusion that it is more than enough to simply interpret the precise price/volume action of individual stocks in real-time. Often that leads to more accurate and actionable conclusions than simply focusing on index action.
If I'm simply interpreting the action of Chinese markets today, my conclusion would be that they are likely to head lower. The real-time evidence points to that as a higher probability over time, without having to make comparisons to historical index action. How such a decline plays out however, is difficult to predict as it may hold many surprises along the way.
I do not mean to throw water all over your analysis, but add the benefit of my own experience in making such comparisons only to find that they do little to help me make real-time decisions and, more importantly, make money. I have also learned that real-time price/volume action is best interpreted with an entirely open mind, and without a pre-conceived, rigid bullish or bearish bias that might be created from trying to impose some sort of macro-analysis over that real-time price/volume action. All that said, I can definitely relate to your enthusiasm when it comes to studying the markets!
| First published: | 17 Jan 2016 |
| Last updated: | 17 Jan 2016 |