
FAQs Frequently Asked Questions
The 620 is shorthand for 6 period exponential moving average and 20 period exponential moving average on a 5-minute bar chart. It is an intraday trading guide that can help one enter stocks that are pulling back constructively, though a volume dry up pattern where the stock starts to trade in a tight range on lower volume near support is also a good clue that the stock may be setting up to move higher, so if one cannot watch their stocks during the day, these daily patterns also work well. We have discussed this in some detail in a number of our webinars.
The 620 can also be used on buyable gap ups. When a stock gaps higher at the open and qualifies as a buyable gap up, buying at the open carries the risk that the stock may move lower and close the gap, thus invalidating the BGU pattern. If one buys at the open, one would be stopped out at a loss. The 6/20 moving averages can be used as a guide to prevent one from buying the stock prematurely. Then when the MACD crosses, the stock can then be bought. Then look for confirmation where the 6 period moves above the 20 period line. Then hold as long as the 6 period line remains above the 20 period line. Sell once the 6 period line moves below the 20 period line.
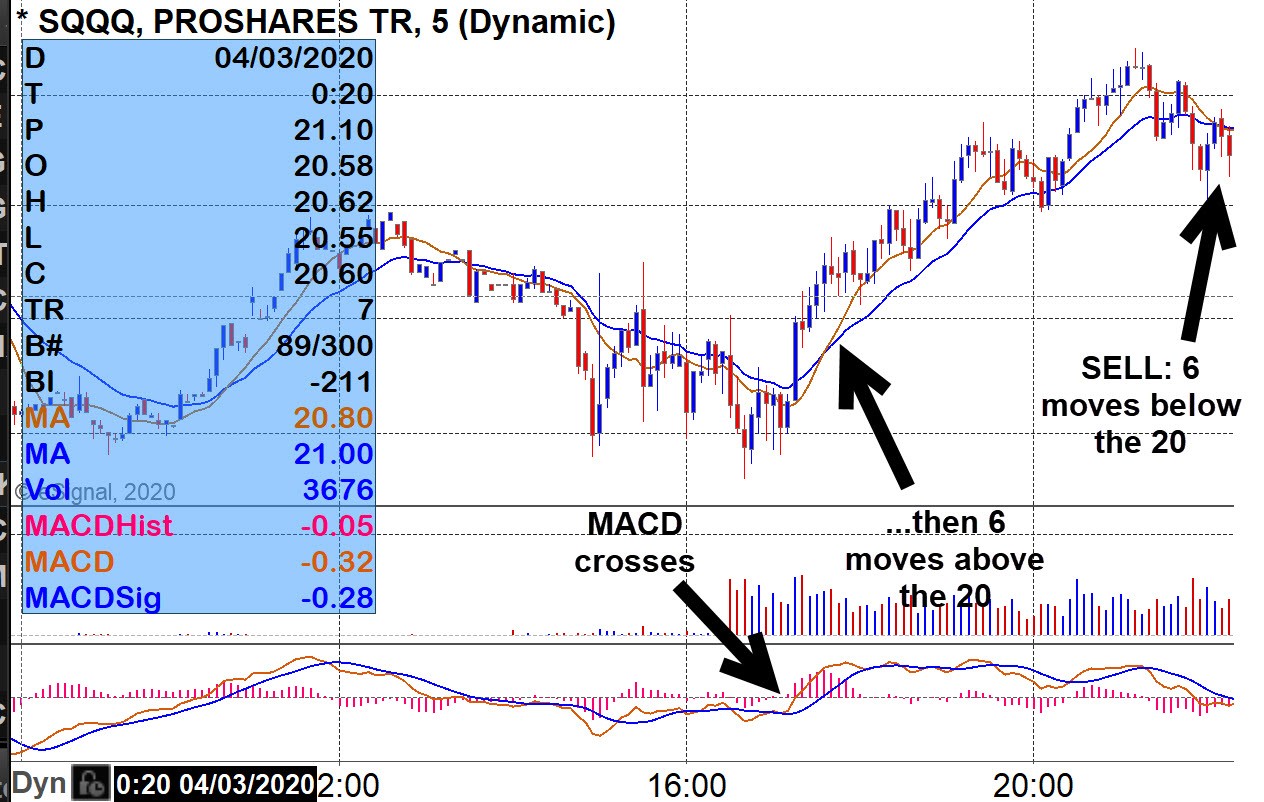
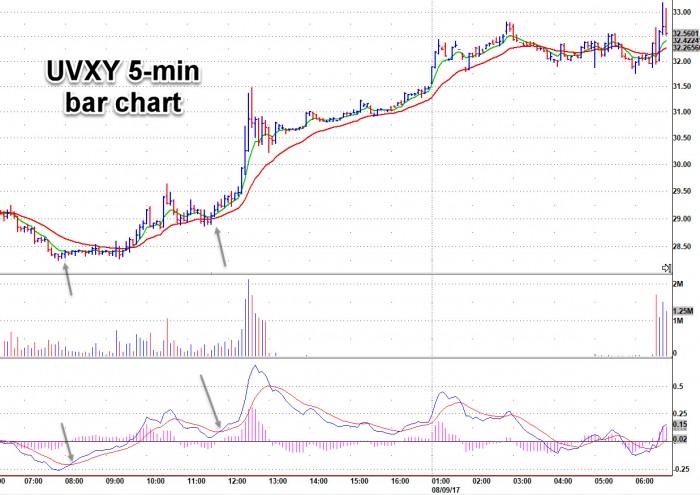
Finally, the 620 can be used to buy volatility ETFs such as UVXY. To set up a 620 chart: use a five-minute intraday candlestick chart with a 6-period exponential moving average and a 20-period exponential moving average on the price data portion of the chart. In the lower MACD part of the chart, use a MACD with a 6-period "fast" line and a 20-period "slow" line. The settings on eSignal charts for the MACD indicator is (6,20,10,C) and also shows a MACD histogram which shows when things are getting "stretched" to the upside (or downside).
The MACD is set as 6,20,10,C on 5-minute eSignal charts.
6 is the fast line20 is the slow line
Both are EMA
Signal smoothing is 10 periods
MACD Line: (6-period EMA - 20-period EMA)
Signal Line: 10-period EMA of MACD Line
MACD Histogram: MACD Line - Signal Line
C = closing price
When the 6-period "fast" line crosses above the 20-period "slow" line in the lower portion of the chart, that is a potential entry point. The best entry points usually come after the fast line has been trending under the slow line then rises above it:
But keep in mind market context is key thus the price/volume of leading stocks and major indices must be taken into consideration to reduce the number of false signals. Typically, losses on false signals range anywhere between a negligible gain and a 1-2% loss while gains are often in the high single or low double digit percentages. One true signal therefore more than makes up for several false signals.
| First published: | 9 Aug 2016 |
| Last updated: | 15 Apr 2020 |