X
Tired?
Unfocused?
Off your game?
Read our free, updated as of Mar 3, 2022, Dr K report on how to optimize your mind and body so you can boost your focus when trading the markets.
YES, SEND ME THE REPORT !
Meet Dr K !
Chris Kacher
  • Nuclear physicist
  • Stock & crypto market wizard
  • Blockchain builder
  • Bestselling author
  • Top 40 charted musician
  • Biohacker
  • Former computer hacker
YES, SEND ME THE FILE !
YES, SEND ME BOTH !
Your email will always remain private.

FAQs Frequently Asked Questions

Dr K Market Direction Model
What are the long term returns of your model if you used a 3x ETF that approximates 3-times the NASDAQ Composite?
If 3x ETFs existed then, the returns would be roughly 3-times the returns of the model which used the NASDAQ Composite, or 33.1% x 3 = +99.3%/year. Keep in mind that drawdowns would also be 3x, thus the maximum drawdown recorded in real-time in 1999 of -15.7% would be 3-times this amount, or -47.1%, more than most people can stomach. Still, since I've worked with the model in real-time since 1991, I am comfortable with this knowing the odds are incredibly high that the model will eventually more than make up for it. In fact, in 1999, I was strictly trading stocks and had the worst drawdown of my career of nearly 50% (unrelated to the model, but due to the choppy sideways volatility that ran from March to October of 1999). I lost no sleep because I knew such unusually challenging markets always come to an end. Had I become discouraged, I would not have been able to capitalize on the last 3 months of 1999 and finish the year up +451% in my personal account and +581% in the institutional level firm account (much bigger money).

Note, above I say roughly 3-times because some 3x ETFs have slight variations against the NASDAQ Composite. For example, TQQQ has a slightly better risk/reward profile than TYH, but TQQQ did not exist when we started tracking the model's performance against a 3x ETF in 2009 that roughly approximated the NASDAQ Composite, so we went with TYH.


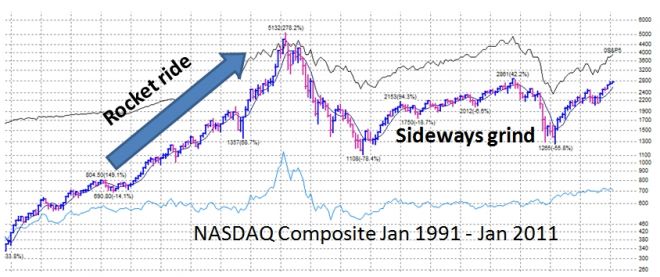
The last decade has been more challenging as it represented the top of the market in March 2000, the bursting of the bubble, then the sideways, reluctantly grinding rallies of 2004-2007.


For Jan 2000 - Dec 2010, the model's total returns using NASDAQ Composite (1x ETF QQQQ is a good proxy) were +741.1% vs NASDAQ Composite buy-and-hold of -34.8%. This is an annualized return of +21.4%/year using 1x ETF QQQQ, or +64.2%/year using a 3x ETF such as TYH or TQQQ, both which make good proxies to the NASDAQ Composite. While +21.4%/year is under the model's returns from 1974-present of 33.1%, it still is one of the best returns achieved timing the market in the last 10 years.

First published: 2 Feb 2011
Last updated: 2 Feb 2011