
FAQs Frequently Asked Questions
2 key weaknesses:
1) Trendless volatile markets are the most difficult. This would include periods such as:
a) May 4, 2009 - July 10, 2009. Four false signals in a row.
b) February 1999 - August 1999. Five false signals in a row, a profitable signal, then another five false signals in a row. This resulted in the model’s largest drawdown of -15.7% in its 35+ year run. As you can see in the performance figure above, the drawdown during this period is still small relative to the overall performance of the model. The Nasdaq Composite, by comparison, had -78.4% as its worst drawdown.
Interestingly, we both achieved our highest returns for 1999 in both personal accounts (Kacher: +451%, Morales: +1009%) and O’Neil firm accounts of (Kacher: +566.1%, Morales: +516%) because we went long the right stocks on buy signals.
Increased volatility seen in 2008-2009 has shown false signals from the model to lose typically between 1.5 to 2.5% instead of the normal 1.0 to 1.5%.
Case in point: Actual results from March 12, 2009 [the date of the first major buy signal generated by the model in 2009] to August 24, 2009 [the date the study was done], which experienced two uptrends and a period of trendless volatility where the system had four false signals in a row [100% long on buy signal, 100% short on sell, 100% cash on neutral]:
| Nasdaq Composite |
$1 becomes |
TYH (3x ETF) |
$1 becomes |
||
| 3/12 |
Buy |
1426 | 1.21 | 45.3 | 1.63 |
| 5/28 | Short |
1728.9 | 1.18 | 73.8 |
1.5 |
| 5/29 | Neutral |
1768.2 | 1.18 | 79.9 | 1.5 |
| 6/1 | Buy |
1828.6 | 1.16 | 88.1 | 1.46 |
| 6/17 | Short |
1795.5 | 1.14 | 85.3 | 1.39 |
| 6/19 | Neutral |
1831.1 | 1.14 |
89.4 | 1.39 |
| 7/7 | Short |
1770.1 | 1.13 |
81.3 | 1.33 |
| 7/13 | Buy |
1793.2 | 1.27 |
85 | 1.90 |
| 8/24 | 2018.0 (close) | +27% | 121.4 | +90% |
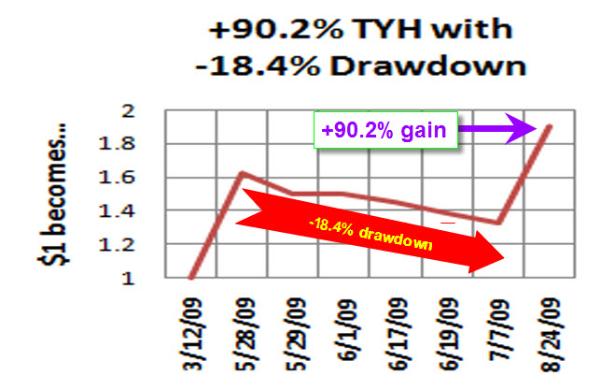
As you can see, using 3-times ETF TYH yielded a +90.2% return from March 12, 2009 to August 24, 2009 which is stellar, however, you had to endure four false signals which totalled to a -18.4% drawdown, on the way to being up +90.2%, due to using a 3-times ETF in addition to the increased volatility which caused larger than normal losses on false signals. Had you traded a 1-times ETF instead such as QQQQ which is a good proxy for the Nasdaq Composite, you would have made a +27% return, but with just a -6.6% drawdown. You must decide your personal risk tolerance. Keep in mind the model has outperformed every market cycle back to 1974 as well as January 1929-December 1932 and has had only two down years, 1993 and 2007, in its 35+ year run. It has averaged +33.1%/yr July 1974 to December 2009.
2) On very rare occasions, the model may still signal a sell even though top quality stocks are breaking out of sound bases. This occurred in March 1996 when stocks such as Iomega (IOM) broke out. I started buying such stocks, overriding the sell signal from my model. Fortunately, such times are extremely rare. Ultimately, let the stocks tell you what to do. If enough good names are breaking out of sound bases, start buying. If the names you hold are hitting your sell alerts, sell without question.
| First published: | 22 Jun 2010 |
| Last updated: | 22 Jun 2010 |