
Many headwinds for the stock market await. Rising taxes, potentially rising tariffs, overregulation, the eventual rise of interest rates, and the reckless printing of money all work against an economic recovery. Here are some possible scenarios:
DEPRESSION? It could be argued we are already in a depression. Big headwinds lie ahead for the stock market due to higher taxes and potentially higher tariffs. Rising taxes and potentially rising tariffs which could spark trade wars are a repeat of what went on in the early 1930s. In the UK, the effective tax rate for companies and high tax bracket earners last year went from 40 to 50% with an effective 60% being the reality, prompting such companies and individuals to relocate to other nearby countries, thus lowering total tax revenue. In the U.S., the Bush tax cuts are set to expire on January 1, 2011. Taxes not just on a federal level but also on a state, city, and local level have already been on the rise in the U.S. As an interesting comparison, in June 1930, the egregious Smooth-Hawley tariff was passed into law which sparked trade wars between nations. Then from 1931-32, taxes were raised on a variety of levels which was the final nail in the coffin. History now knows the 1930s as the decade of the Great Depression. Are we on the path to repeat history?
Congress should keep the Bush tax cuts going. History has shown time and time again that lower taxes for the middle class and wealthy as well as cuts for corporations of all sizes spur growth in the long run. The reason why governments and politicians keep making the same mistakes is because they're politicians first, and look to get reelected. They can garner more of the popular vote and win reelection by hiking taxes on the rich and on corporations, even though history has shown this is anathema to growth.
RECESSION PART 2? STAGFLATION? Rising interest rates can be a headwind for the markets. Because of missteps by the U.S. government, they have no choice but to keep rates ultra low so the recovery stands a chance. With rates at historically low levels, and with quantitative easing having been nearly exhausted, has the fed used up all the bullets in their gun? Has keeping rates at historically low levels while printing money and artificially fueling the stock market with quantitative easing programs doomed the market to see a second recession? Wouldn't it have been better for the Fed to make the market take its medicine by not rescuing all these zombie banks and businesses? Yes, it would be very painful for a year or two, but then the economy would be a lot healthier than it is today and higher growth could resume. As it is, we are coming up on two years since the crash of 2008, and the signposts ahead look ominous.
Since interest rates eventually have to start moving up again once the economy shows signs of real improvement and banks start lending again in earnest, I looked at the start of each interest rate tightening cycle going back to 1945. Since 1945, there have been nine tightening cycles as defined by interest rates having been held steady for at least one year then being hiked. This results about half the time in either a big drop in the market (1946, 1973-74, Oct 1987, early 1994), or sideways, choppy market action over the ensuing months and even years (2004-mid 2006, 1994, 1988, 1946-49). Incidentally, the unusually aggressive discount rate hikes in 1929 (the fed hiked rates 1% in July 1929 alone!) were a big the nail in the coffin, much as they were from Aug 1999 to May 2000.
Rising regulations such as the Volcker rule plus other stiff financial reform are, historically speaking, rarely ever good for economic growth. These stiff regulations come as no surprise since the U.S. government uses crises situations as an excuse to pass regulatory reform. Examples abound such as:
a) RICO acts
b) reduction of 1/8 to 1/16 in the late 90s which severely hampered liquidity even though their aim was to help the little guy get better stock prices, but since it caused some market makers to drop out, the net effect was worse prices due to increased slippage in trades, so not really that helpful to the little guy
c) Rave Act of 2001
d) Patriot Act I and II
In most cases, the laws are redundant or hamper long-term growth but are voted into law because to the average person, they sound good on paper, but in reality are destructive to growth. Mixed economies carry both statist, ie, socialist, and capitalist principles. Historically, statist has won out as government grows while economic freedoms diminish. Thus the effect of the 'rise and fall of Rome' can be seen among nations that at one time economically led the world. For example, London, at one time, was the financial capital of the world.
HYPERINFLATION? Could we repeat the Weimar Republic of the 1920s with the reckless printing of money that can be observed today? This explains why gold continues higher, even though it may at times be stuck in a trading range for months. The long term trend of gold since 2001 is still up. It has been repeating this pattern of rest-breakout-run-rest-breakout-run since 2001. And the long term rise in gold should come as no surprise since the U.S. dollar lost nearly 40% of its value against major world currencies from 2002-2007. The devaluation of the dollar has been alive since 2001 as shown in the figure below.
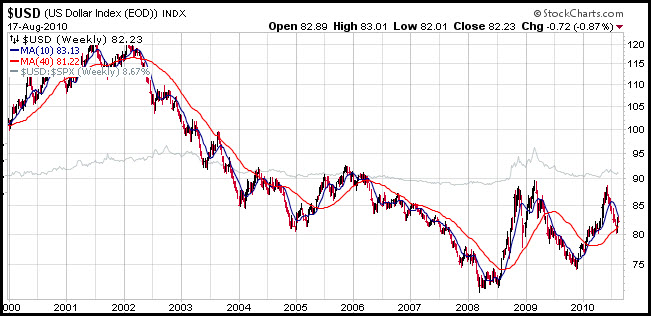
Figure 1 U.S. Dollar Index showing U.S. dollar value against six major foreign currencies- the European nation Euro, Japanese yen, Swiss franc, Canadian dollar, Swedish krona, and United Kingdom pound.
NONE OF THE ABOVE? The U.S. is the tallest standing midget right now compared to Europe, U.K., middle east, and it could be argued, Brazil, Russia, and Australia. China has its share of headwinds though the BRICS (Brazil, Russia, India, China) are fast growing emerging markets that did not exist in the 1930s, so this is the wildcard which could make any oncoming depression not so "Great" as deleterious effects are minimized. In essence, the hypergrowth of China and India could help stabilize the world economy. It goes back to the principle that one country's success spills over into other countries since the world is connected more than ever before, and a rising tide lifts other boats. Thus India's and China's potential prosperity as they continue to grow at or near double digit percentages, as 6% GDP annual growth is recessionary for these two countries, creates more production, more trade, more jobs, and more outsourcing by companies who can hire Chinese and Indian workers at a lower price.
That said, in early 1930 before the Great Depression set in, the U.S. was looking like it would continue to lift other boats as its prosperity was unmatched. But its tax and tariff policies killed any possibility of an economic recovery. So China and India will have to be smart in guiding their economies in these treacherous times by not creating trade wars which are the biggest danger, otherwise they too shall fall just as hard as the rest.
THE FUTURE= The Market Direction Model is currently on a sell signal. As usual, it will issue subsequent signals as it sees fit. Should the market take a tumble, the wide array of inverse ETFs in existence should help one profit in these challenging times. Note, the selling pressure detected by the model can occur while the market is rising, so the signal can, on occasion, come very near the top, as it did near the end of April 2010 before the market had its mini-crash. We will recommend appropriate 1x, 2x, and 3x ETFs when there is a change in signal.