
Jesse Livermore spoke about the century mark in stocks. When a stock crosses 100, if it can do so with sufficient buying pressure, it is liable to continue significantly higher. The same applies to major market averages. The Dow Industrials has been teasing everyone over the last month as it continues to stall just before its 20,000 mark. It has done so a number of times today, coming just 0.37 points shy of the 20,000 mark. Indeed, some market participants may be attempting to manipulate the markets.
Today we share two other milestones in the Dow Industrials.
Back in March 1999, the Dow crossed 10,000 as shown in the chart below.
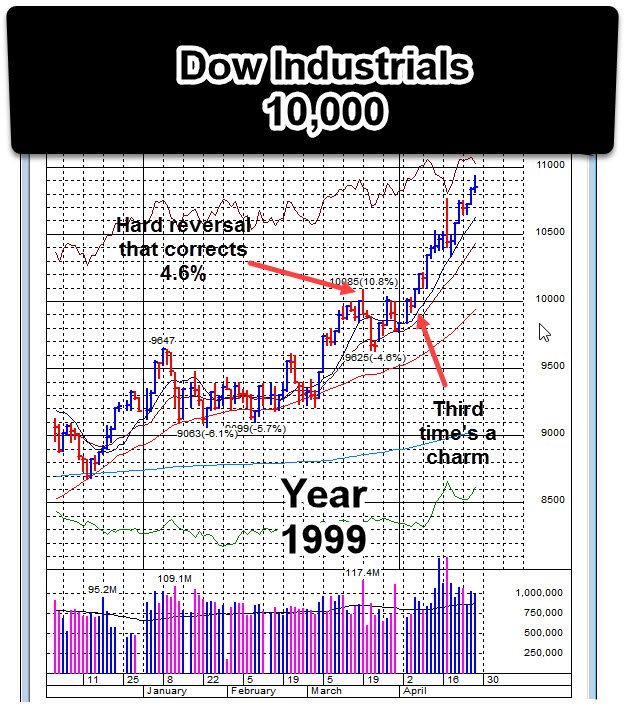
It then promptly had a high volume reversal that same day, finishing down -4.6% over the next four trading days. It took a third attempt through 10,000 for the Dow to successfully cross 10,000.
Then back in 1966, the Dow approached 1,000.
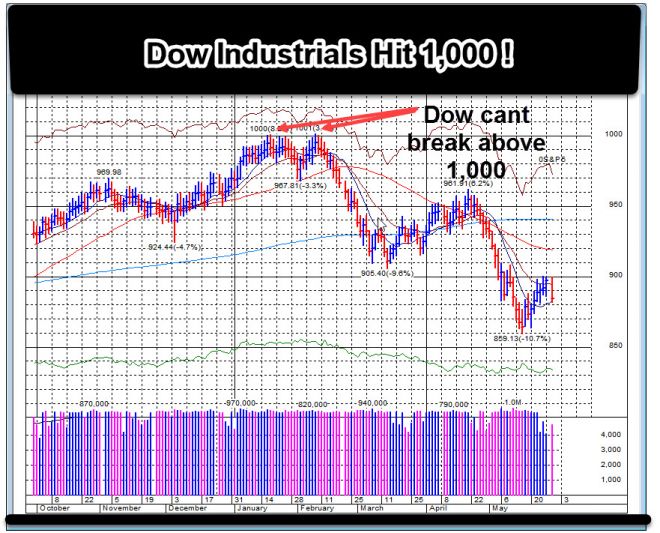
It was never able to definitely cross well beyond 1,000. It was not until 1982 that the Dow finally crossed 1,000 successfully which of course kicked off the brand new bull market.
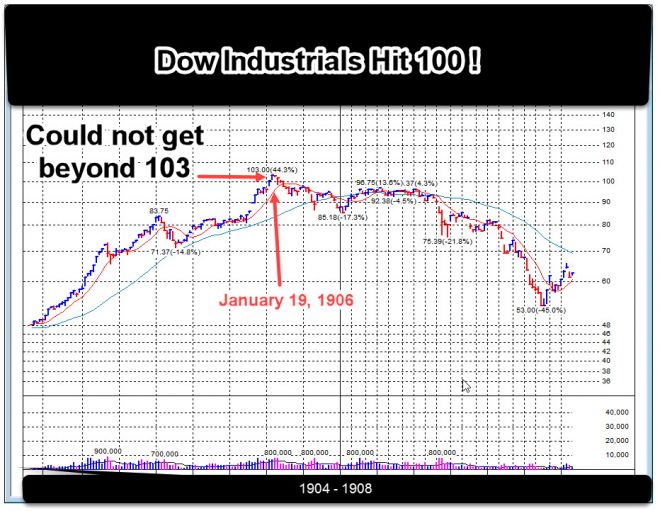
Then what happened in on January 19, 1906? The Dow crossed 100 for the first time !
It will be interesting to see how the markets trade after the Dow crosses 20,000. After a month of back-and-forth just shy of 20,000, "when" is still up for grabs.
Should the Dow move through 20,000 in convincing fashion, this implies it will probably head much higher as it began its current uptrend on November 7, 2016. That said, it could repeat what it did in March 1999. If so, its price/volume action would reflect a bout of selling pressure pushing it back below 20,000 with some force. That could signal an excellent opportunity to go short those stocks trading just below resistance. This allows you to keep your exit point close to where you initiated your position which keeps risk to a minimum.
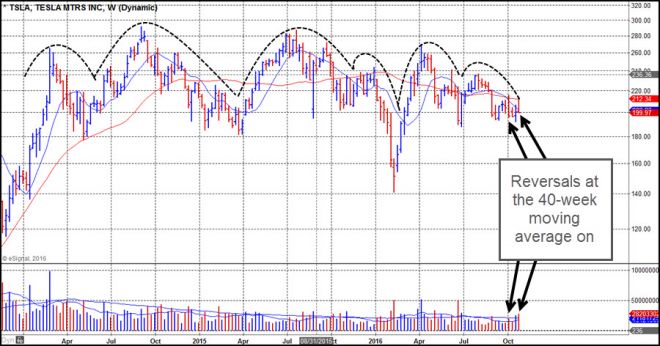
In the chart below, we suggested members go short TSLA on the last period shown as TSLA had a reversal on higher volume after encountering resistance at its 40-week moving average. One could then use a move above its 40-week moving averages as their cover point should it move against you. But instead of rising up into resistance, TSLA proceeded to fall more than -10%.
Alternatively, one could buy inverse ETFs such as PSQ and SQQQ which is 1-times inverse the Dow Industrials ETF DIA and 3-times inverse the NASDAQ-100, respectively. These ETFs move higher when their respective major average moves lower.
Keep in mind this bout of selling pressure may very well be contained to just a few trading days, much as we saw in the March 1999 example above when the Dow crossed then reversed lower after hitting 10,000 for the first time. One secret to successfully shorting stocks is to be quick to take profits once the stock is nearing a support point as short squeezes can quickly reverse most of the gains made.
To gauge market direction, monitor the price/volume of leading stocks. If a number of leading names have healthy looking charts, that is a good indication of a market that wants to go higher. One could then be quicker to take any profits made on the short side by covering their short positions or selling any inverse ETFs.
Back in March 1999, leading stocks were still showing signs of wanting to continue their uptrends. Thus any profits made by shorting stocks or buying inverse ETFs in the few days following the March 19, 1999 high volume reversal in the Dow Industrials should have been taken.
On the other hand, if many leading stocks have broken down and/or are struggling back to areas of resistance, that is a red flag. New short positions could be initiated on any stocks that weakly bounce into areas of resistance.
Remaining fluid in the market is essential. Profits in shorts often takes just a few days to achieve since stocks take the stairs up, but typically take the elevator or trap door down. Once profits are taken on the short side, one could then immediately look for stocks with leading fundamental and technical characteristics that are trading close to major support areas (10-, 20- and 50-day moving averages are commonly used) to initiate buys.
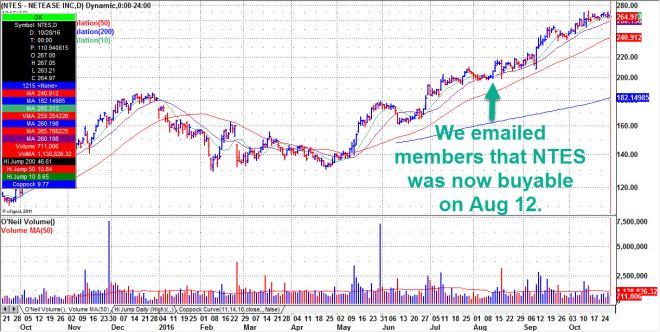
One such stock was NTES on August 12, 2016. It had both the underlying fundamentals and technicals to make it through our rigorous filters. It then proceeded to march higher even in the face of a sideways then declining market.
Of course, the Dow could repeat what it did after it crossed 100 and 1,000, which was to have a significant about-face after crossing the milestone and head lower, sometimes for weeks if not longer. Monitoring the price/volume of leading stocks and major market averages is always key as it will keep you on the right side of the market. When it comes to making money in stocks or ETFs, we don't care whether we are on the long side or the short side as long as we are on the right side.
As everyone knows, timing is everything. At Virtue of Selfish Investing, we email members in real-time to let them know of any long or short set ups in stocks or ETFs as they occur. We mention this not to market our services to you, but to underscore the fact that timing is key when it comes to your investments. Whether or not you're following any investment website is irrelevant. Always have your alerts ready at all times so you can take action on your stocks and/or ETFs in the moment. We use a real-time stocks app on our mobiles so we're alerted even if away from the desktop. And always keep a trading journal so you can highlight your mistakes to avoid making them in the future.
At Virtue of Selfish Investing, we email members in real-time as to any long or short set-ups in stocks and ETFs as they occur. The action in major market averages can be key. A number of profitable opportunities always arise. See our archives for examples.