
Market Lab Report / Dr. K's Crypto-Corner
by Dr. Chris Kacher
The Metaversal Evolution Will Not Be Centralized™
Scenario: Dead bat bounce; downtrend continues to 1Q 2023
The current bounce is likely nothing more than one of the dead bat variety thus markets will eventually continue their downtrends which started at the end of 2021. That said, such bounces can last for many weeks and be quite sharp as this is what happened during the bear markets of 1930-32 and 2000-02. Both were the result of massive market bubbles which had to be unwound.
Potentially by the first quarter of 2023, markets will capitulate due to the Fed having hiked rates two to three more times, putting the fed funds rate at 500-525 bps (or 475-500 bps). This would probably mark a major low and a potential buy signal for BTC and ETH. Case in point: Dec-2018 was the major low because as markets had their first Christmas crash on Dec 24, the Fed stepped in and halted the tightening of the balance sheet. A major buy signal came just over 2 months later in Mar-2019. That said, the macro environment now is far worse than back then so the downtrend could continue even if the Fed starts to lower rates if 1930-32 and 2000-02 are any guides.
Scenario: Sloppy sideways markets
Goldman Sachs recently said they believe the terminal rate will be substantially higher than 500-525 bps due to persistently high inflation despite coming off peak. They therefore believe the Fed will be forced to hike at least a few more times in 25 bps increments in 2023. Should their prediction not come to pass, the elevated fed funds rate at 500-525 (or 475-500) could still remain in place for much of 2023.
In consequence, QE-lite could become an enduring factor which could result in extended sloppy sideways market action over the next year. This happened to crypto in 2015 after the crypto capitulation in Jan-2015 which was a buy signal when Bitcoin touched $150, though the reasons for sideways action that occurred through most of 2015 were due to the tug-o-war between innovation driving crypto and questions about whether crypto would survive.
Today, the level of debt remains massive as the QE bubble slowly unwinds, so as interest rates rise, the amount of capital needed to service the debt has been and will continue to be "printed" in the form of QE-lite. This is also being practiced by other central banks such as the Bank of England. How long sideways choppy markets last depends on key variables including the length and depth of the recession as well as the Fed halting the rate hikes or lowering rates once again. Markets (both stocks and crypto) often find major lows before recessions begin since markets are forward looking by 6-9 months.
Scenario: New bull market
Alternatively, if the Fed starts to print large sums, ie, trillions, once again due to another black swan event such as we saw as a result of the post-2008 financial meltdown and the COVID pandemic, we will likely see a new bull begin. There are no guarantees of if or when such a black swan will materialize, but such a major event could be spurred in part by the lack of Treasury liquidity which has deteriorated significantly. Despite the massive Treasury market, these days, buying even $100 million in bonds can be difficult because major countries such as Japan and China are stepping back while the Fed continues to tighten the money supply.
Debt delinquency continues to spike higher as well which would be another factor that, together with other issues, could create a major black swan as factors are often interconnected which can create a domino effect resulting in a black swan.
Markets
The CME FedWatch Tool is currently pricing in two more 50 bps hikes then a 25 bps hike for a terminal rate of 500-525 bps. But as the Fed's Bullard said this week, it is data dependent on inflation. At present, he expects a terminal rate between 5-7%. So CPI, PPI, and PCE are critical. Goldman Sachs thinks inflation will remain stubbornly above the Fed's 2% target, even after coming off peak, so expects a much higher terminal rate as a consequence of a few 25 bps rate hikes.
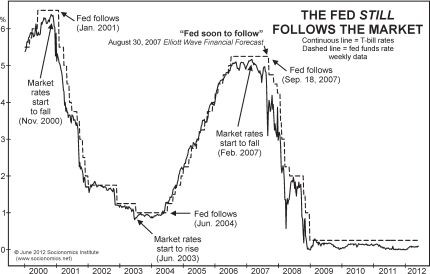
But history over the last century shows us that when the Fed starts to pivot to lowering rates, it is too late. Unemployment soars, people spend less, earnings plummet, and the question is how deep and long does the recession last? Rate hikes break something material in the economy, but such hikes are inevitable especially when trying to unwind a massive bubble or tame inflation. Today, we have both. So despite the Fed cutting rates, the stock market continues to fall. This was true in 1930-32, the 1970s, and 2000-02. Ultimately, the Fed follows the market. When the market has material gains, they hike rates. When the market has material losses, they reduce rates.
But because of Fed-speak, there is hope that such a halting or reduction of rates marks a major low in the markets. In reality, such creates a dead bat bounce that can last for weeks, but history shows such bounces always roll back over with major stock markets plumbing to new lows with the Fed having to continue to lower rates.