
by Dr. Chris Kacher
A brief history of debt
US debt
August 1995 $5 trillion
August 2005 - $8 trillion
August 2015 - $18 trillion
August 2025 - $37 trillion
August 2035 - $80 trillion (est)
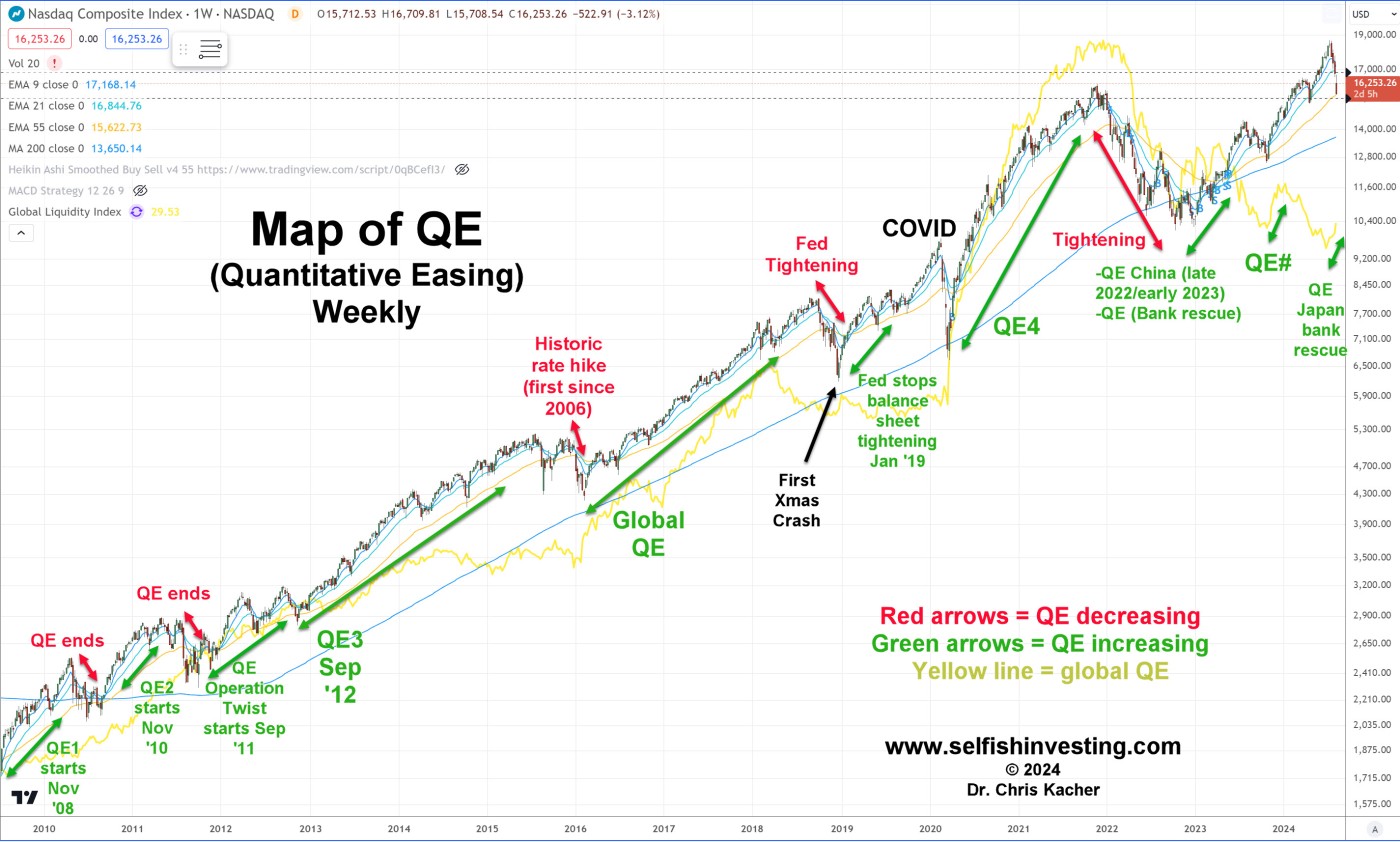
Debt used to rise more slowly prior to the Great Financial Collapse of 2008 when the Fed launched quantitative easing programs. Since then, debt roughly doubles every decade. Every nation is in debt to the tune of over $300 trillion, some 300% of global GDP. The debt is never repaid but just gets rolled over as governments let inflation do its job. To prevent the printed money from spiking CPI and PCE, the government encourages inflation of asset bubbles to soak up the money supply such as stocks, real estate, and gold. This debt Ponzi scheme will continue until its final destination of hyperinflation. But due to material increases in AI-based productivity, the aim is for the world to grow out of its never ending debt as they did post World War II.
This year, the US raised the Federal debt ceiling by another $5 trillion to accommodate Trump's latest package. Think also of the latest RMB10 trillion ($1.4 trillion) surge in Chinese liquidity in 2025 and the increasing use of short-dated Treasury bills to fund America’s Federal deficit. Global debt surged in 2008 during the GFC when $5 trillion was created then again in 2020 when the COVID emergency digitally printed $35 trillion. Monetary inflation hedges including stocks, gold, and, particularly, Bitcoin, will continue to outperform, underpinned by rising global liquidity.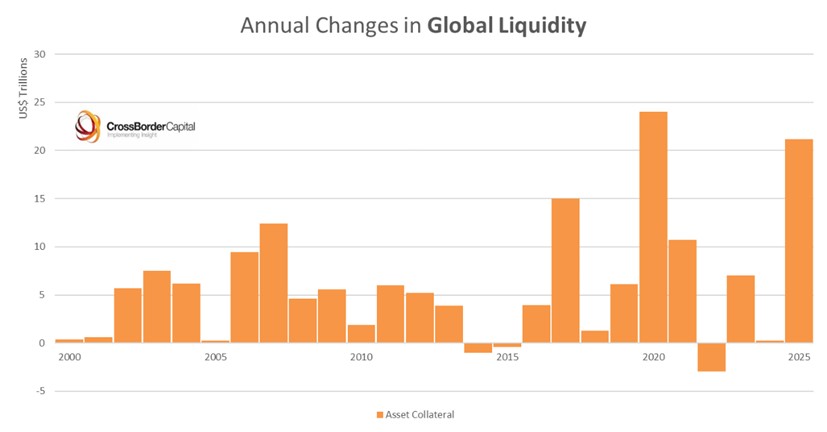
All of this is why bear markets are always temporary, so should be embraced where the greater the deviation from the high, the greater the buying opportunity being presented.
Real estate is another bubble waiting to burst. Since the bubble popped in the early 90s after a roaring 70s then 80s, real estate has soared. Its bubble then burst in 2008 sending prices crashing until 2010. Since then, it has been soaring once again.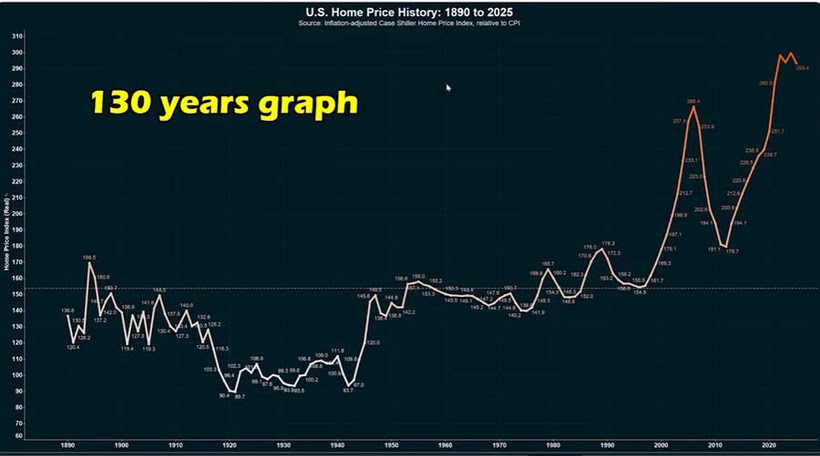
Overvalued?
When it comes to the stock market, more than 1 out of every 4 companies in the S&P 100 have a P/E above 50 and 2 out of every 3 companies have a P/E ratio above 30. This is not normal but it is also not normal that the Mag 7 has actually become cheaper so far this year due to major earnings beats despite their dramatic rises in price. The S&P 500 and NASDAQ Composite continue to telegraph that investors are bullish thus they both keep setting new highs.
 |
This global liquidity party in risk assets may not end soon, but we all know that it never ends well. The can gets kicked down the road until a major debt funding crisis. To ensure financial stability, more debts demand more liquidity from policymakers. The key role played by global liquidity in refinancing debt means that it comes down to judging how fast our future debts will grow. Fiscal dominance forces central banks into ever greater monetary inflation. In this world, hard assets, stocks, Bitcoin, precious metals, and real estate make great hedges, until they dont.
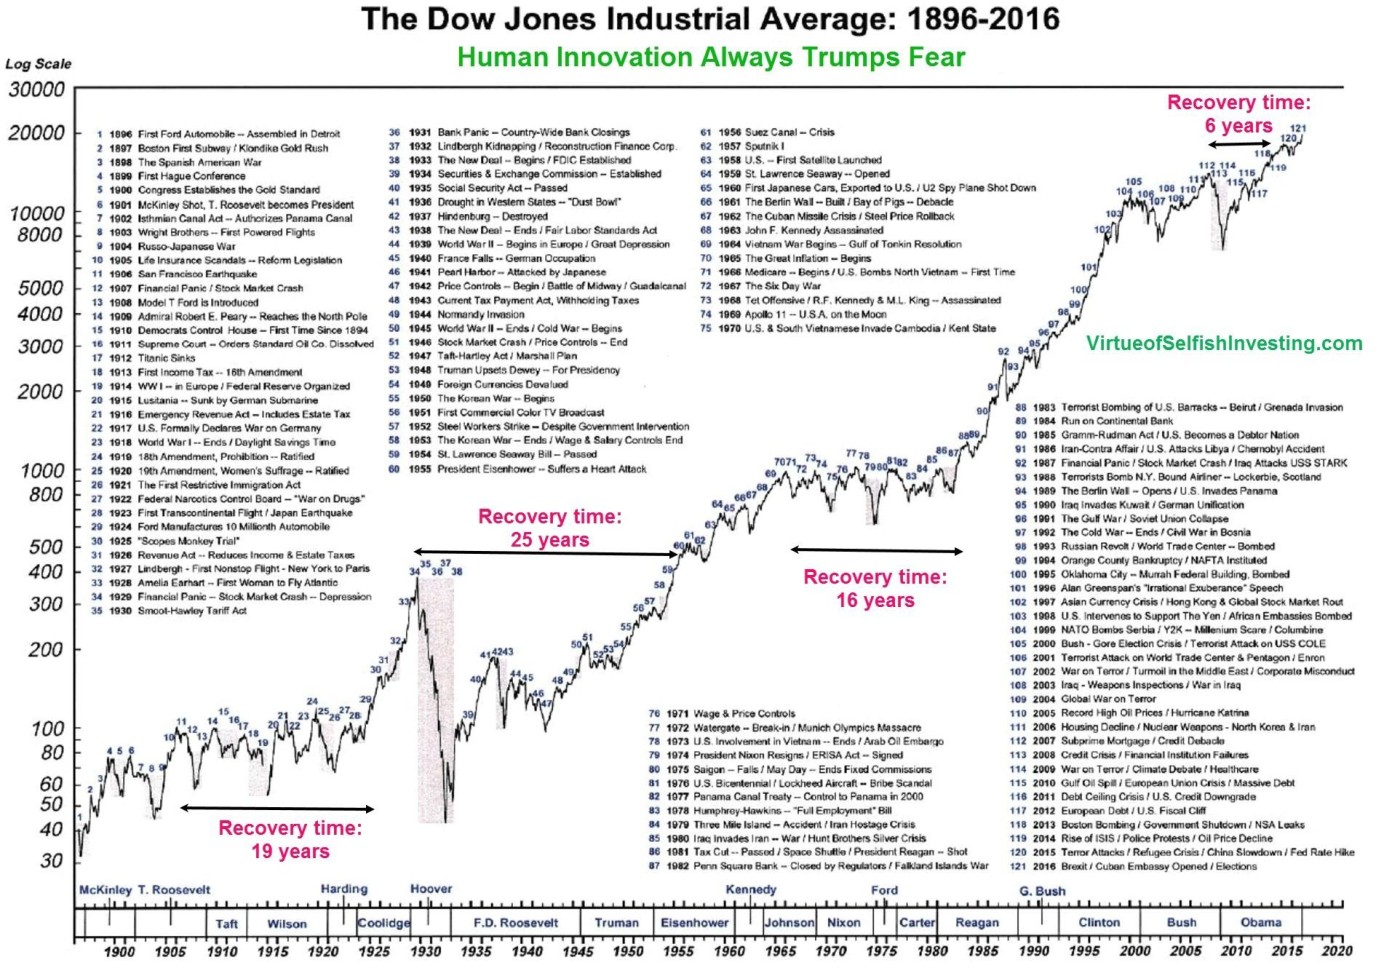
That said, the last century of price data shows that markets always rebound. The deepest correction by far was in the 1930s after the 1920s stock market bubble when the Dow lost 90% of its value, though interest rates and liquidity guided markets sharply higher even back then after the Fed conducted large-scale open market operations from April to June 1932, which significantly increased the money supply by about $1 billion. This was a form of quantitative easing aimed at providing liquidity to the banking system and stimulating the economy, which in turn helped lift stock prices when the Dow doubled in just a few months from June 1932 lows.
So the macro aspects of liquidity have always worked in guiding market direction. We also had the 78% correction in the NASDAQ Composite, its steepest drop by far, after the 2000s after the dot-com bubble burst after liquidity slowed after which it took 15 years for the index to hit new highs once again.
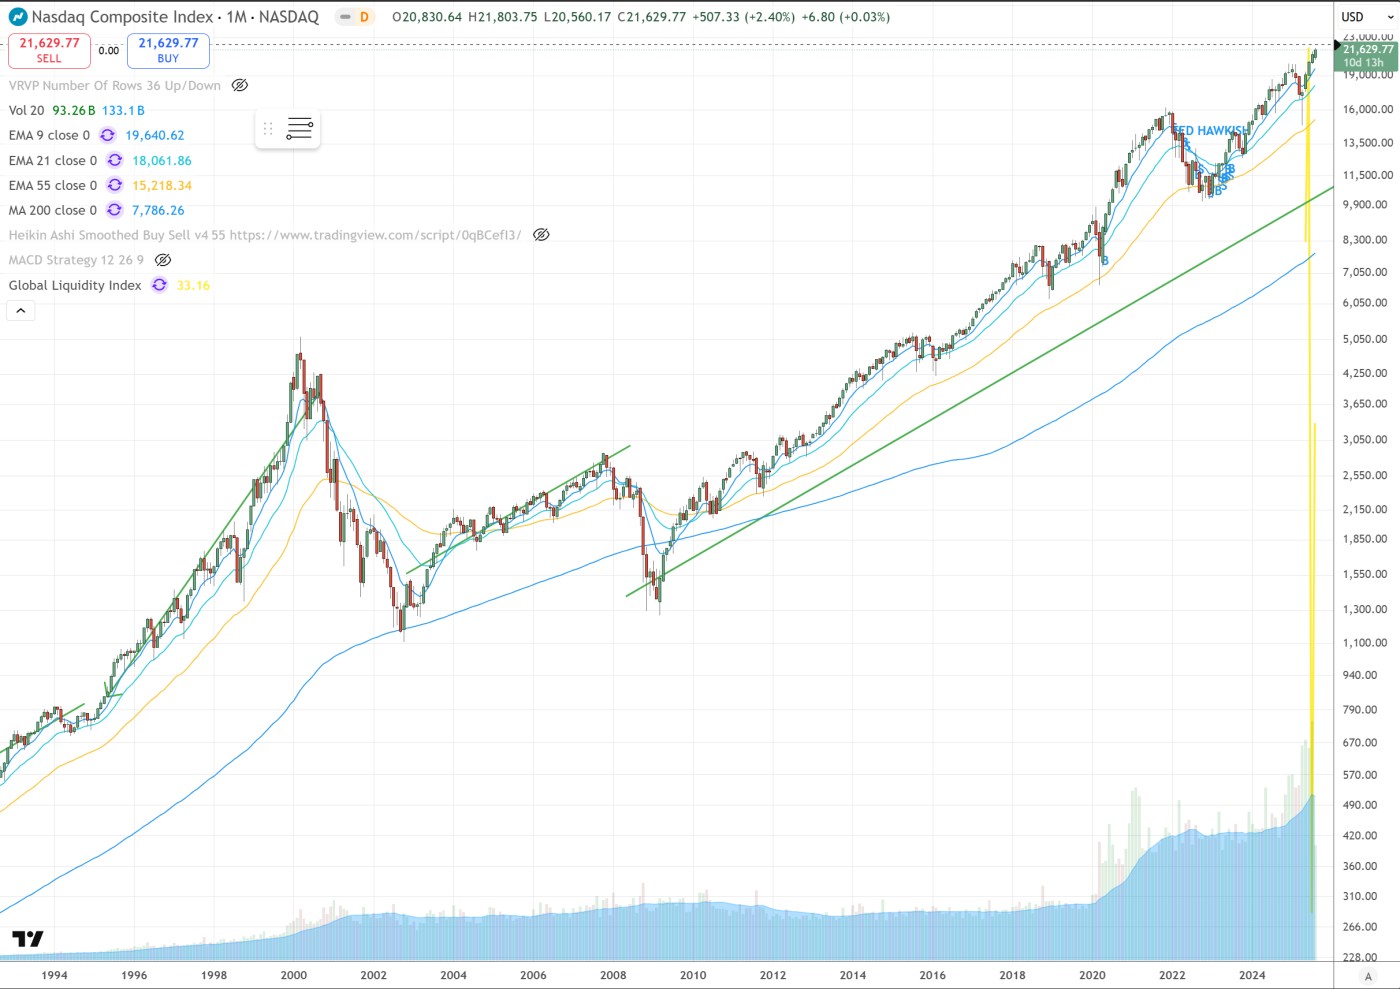
But the rule of buying leading stocks in leading industry groups once global liquidity starts to accelerate such as in early 2019 and early 2023 holds true. Meanwhile, when global liquidity slows, it is time to sell or go short such as when the Fed ended each of its QE programs in the 2010s, in 2016, in 2018, and in 2022.
Note this longer term approach to catch the "meat of the major moves" does not apply to shorter term or swing traders who can enhance their returns by using our various techniques such as pocket pivot, buyable gap up, undercut & rally, and short sale set-ups. We have a market under distribution.