
Dissecting Jesse Livermore's Century Mark Rule - Part 5
By Dr. Chris Kacher & Gil Morales, Managing Directors
MoKa Investors, LLC
Amazon.com (AMZN) is an interesting stock to examine within the context of Jesse Livermore’s Century Mark Rule simply because it has passed through so many century marks since it first came public in May of 1997. It is worthwhile to note that before AMZN was even three years old as a publicly-traded company it had already split its stock three times.
During the dot.com bubble era, stocks ran up in price very rapidly, and AMZN was no exception. This prompted management to split the stock 2 for 1 in June 1998, 3 for 1 in January 1999, and 2 for 1 in September 1999. The first time AMZN approached the $100 Century Mark was on April 15, 1998, when it printed an intraday high of precisely 100.00. It then backed down without clearing the 100 price level, and three weeks later the stock split 2 for 1, its first stock split.
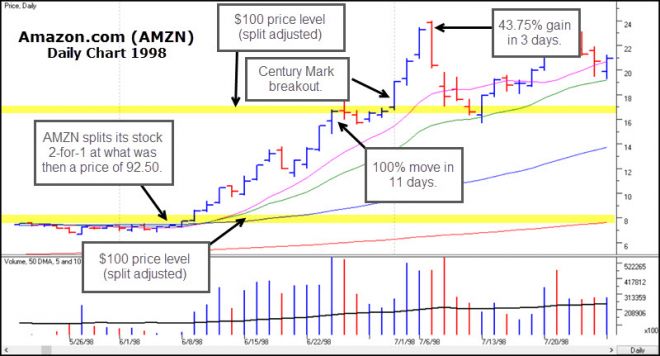
That first 2 for 1 split, effective during the week of June 5, 1998, cut the stock price in half on a nominal basis. The very next trading day of the week after the split took effect, AMZN launched through the $50 price level. Note that this would have been the equivalent of $100 before the split. So, effectively, that was the first time AMZN pushed up through its first century mark at $100, and it led to a 100% gain in 11 days.
The next time AMZN cleared the $100 price level was less than a month after the first 2 for 1 stock split in June 1998, after which it had already doubled in price. So AMZN quickly had its second chance at clearing the $100 Century Mark, and its first on a nominal basis. It did so with great effect on July 1, 1998, running up to 143.75 (a 43.75% move, obviously) in another two days.
We can see these two price moves during 1998 on the daily chart, below. Keep in mind that the prices shown along the right margin of the chart reflect post-split prices current as of 2017. So, if we adjust for all the splits during AMZN’s lifetime, what is shown as $8 on the chart would have been roughly equal to 100 in June 1998 before the first stock-split.
Likewise, the $17 price level on the chart would roughly correspond to what was around $100 back in July of 1998 before the second stock-split. Adjusting for the splits helps us to see that in fact AMZN had strong upside moves following its first Century Mark breakouts.
AMZN then went on to break through the $200 price level for the first time on November 23, 1998. It quickly ran up 16% in two days. The first time AMZN broke through the $300 Century Mark was on December 22, 1998. From there it ran up 85% over the next two weeks. But it did, however, retest the $300 price level once on December 30th before rebounding and nearly doubling in price.
In all four of these Century Mark breakouts posted by AMZN during the first three years of its existence as a publicly-traded company, Jesse Livermore’s Century Mark Rule on the buy side would have worked very well. But that was the dot.com era of the late 1990’s. With AMZN now trading around $900, how has it fared at subsequent Century Mark price levels in more recent history?
For the answer to that, we will move to Part 6 and the next installment of this VirtueofSelfishInvesting.com Market Lab Report article series.