
Dissecting Jesse Livermore's Century Mark Rule - Part 6
By Dr. Chris Kacher & Gil Morales, Managing Directors
MoKa Investors, LLC
Amazon.com (AMZN) was a potent example of Jesse Livermore’s Century Mark Rule during its first three years as a publicly-traded company from 1997-2000. During that period, it cruised right through the $100, $200, and $300 Century Marks for strong price gains. All three lived up to the price-performance expectations of Livermore’s rule on the long side.
The $400 Century Mark, however, presented a much more formidable hurdle for the stock. On December 20, 2012, AMZN finally cleared the 400 price level after being turned back less than three weeks earlier. It then spent the next several weeks somersaulting around the $400 price level before finally losing its grip and plummeting to the downside.
That sent the stock over 100 points lower before it bottomed out at 284.38. A Century Mark failure, but also illustrative of why Livermore also used his Century Mark Rule in reverse as a short-sale entry signal whenever a stock failed to hold a particular Century Mark. In this manner, it was a two-side rule, that could be used on the long or short side depending on what the stock did after first breaking out through a Century Mark.
In fact, the example of Anaconda Copper in 1907 turned out to be exactly this. Anaconda Copper failed to hold the $300 price level, and Livermore discussed this in Reminiscences of a Stock Operator as a “false move” that caused him to short the stock. He went on to make significant profits on the short side of Anaconda Copper by implementing his rule in reverse when Anaconda Copper failed to hold the 300 price level back in February of 1907.
The reality is that a Century Mark can often serve as a major point of resistance for a stock. When a leading stock fails to clear and hold a given Century Mark, it can often occur in synchrony with a breakdown in the general market, as was the case with Apple (AAPL) in January 2008 at the $200 price level. But that’s a topic for another article, so we will leave it for another discussion.
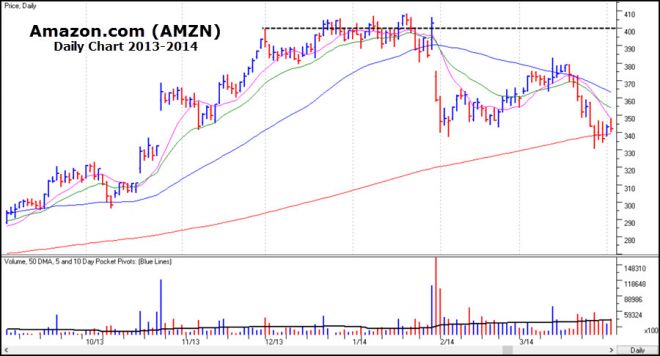
AMZN finished its correction after topping in late January 2014, and eventually made its way back up towards the $400 price level. On March 24, 2015, the stock gapped up well beyond the $400 Century Mark after releasing a strong earnings report.
The stock opened 439, hit an intraday peak of 452.65 and closed at 445.10. Because of how far beyond the $400 level it had moved on the gap after closing at 389.99 the day before, it was not possible to enter the stock near the 400 level as Livermore would prescribe.
At that point AMZN had more or less “shot its wad,” and it did not make any further upside progress from there. Instead, it slowly sank back to the downside before stabilizing and then spending the next two months moving sideways. In this case, there was no big price move to play.
In early July 2015 AMZN started to break out of its two-month consolidation formed after the late April gap-up through 400 and began to approach the $500 Century Mark. Once again, it gapped up after a strong earnings report that was released in the after-hours on July 23rd. The stock had closed at 482.18 on the 23rd, and the next day, the 24th, printed 578.99 at the opening bell. It then traded up to an intraday high of 580.57 and then collapsed to close right near the lows of the day at 529.35. That represented a roughly 10% decline from the intraday peak.
The stock flopped around for about 3-4 weeks without going anywhere and then broke back below the $500 price level a month later. It spent another two months recovering and base-building. So, two Century Mark breakouts through consecutive century marks at 400 and 500 offered nothing in the way of a sharp, playable rally. They simply became too extended too fast.
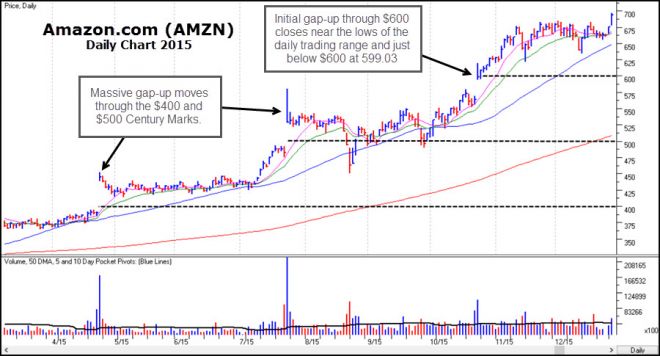
The chart above shows how unusual of a year 2015 was for AMZN. There are three gaps in the pattern, and we’ve already discussed how the first two occurred after strong earnings reports. Because of the proportionally equal time interval we can see between the three upside gaps, we can surmise that the third one was also caused by yet another strong earnings report.
This time, however, AMZN gapped up through the $600 Century Mark. On October 23rd, the stock opened at 617.68, representing a significant gap-up in price vs. the 563.91 close of the prior day. On an intraday basis, it got as high as 619.45 and as low as 595.36 before settling down to close at 599.03. That was a weak showing, to be sure, and was reminiscent of the July gap-up move through the $500 Century Mark.
However, we should point out that Livermore’s Century Mark Rule is just but one arrow in our quiver of buying techniques. Alternatively, all three of these 2015 gap-up moves by AMZN were in fact playable as “buyable gap-ups,” a method of buying such moves that is discussed in detail in our first book, Trade Like an O’Neil Disciple: How We Made 18,000% in the Stock Market.
[Note: To learn more about buyable gap-ups, see the following video: https://www.youtube.com/watch?v=j9cEvu_xOgA]
Based on our rules for handling buyable gap-ups, the first two in April and July would have stopped you out, but the third gap-up in October held above its intraday low of 595.36. It then regained the $600 price level the next day and proceeded to march 10% higher over the next 13 trading days.
All three of these gap-up moves, however, did not measure up to Livermore’s expectations for the implementation of his Century Mark Rule. More recently, AMZN has moved above its $700, $800, and $900 Century Marks, but none of those moves has produced a sharp, rapid upside price move. It could also be due to the psychological factor of each new century mark achieved starts to wear thin as a stock progresses to 600 and beyond.
Also, the “older” a stock gets, the less impact a breakout through a Century Mark seems to have in terms of immediate price performance. This may be a function of the fact that AMZN, given its long-term established position in the market, has become a staple of institutional portfolios. A lot of big money is already in the stock, so as it moves higher the money flows into the stock are proportionately less “intense.” Food for thought.
That said, as AMZN nears the 1000 level, the psychological century mark level could be restored at the magic "1000". The same for GOOGL which also gapped higher to 930 on Thursday's strong earnings. Which will hit 1000 first? Given recent price momentum, it might be a close call.
On to Part Seven…