by Dr. Chris Kacher
Failing fiat
History has shown that, since 1750, about 80% of all currencies have disappeared and the other 20% have all been severely devalued. It is the way of fractional banking which is why the inflation megatrend will never end. Market timing designed to catch the bulk of the uptrends and downtrends is done by careful analysis of critical variables which correlate with general market direction. Bitcoin is particularly sensitive to these variables which explains how calling major tops and bottoms in bitcoin to within a few weeks has been achieved since 2013 in real-time. Stocks too have become increasingly correlated with such variables.
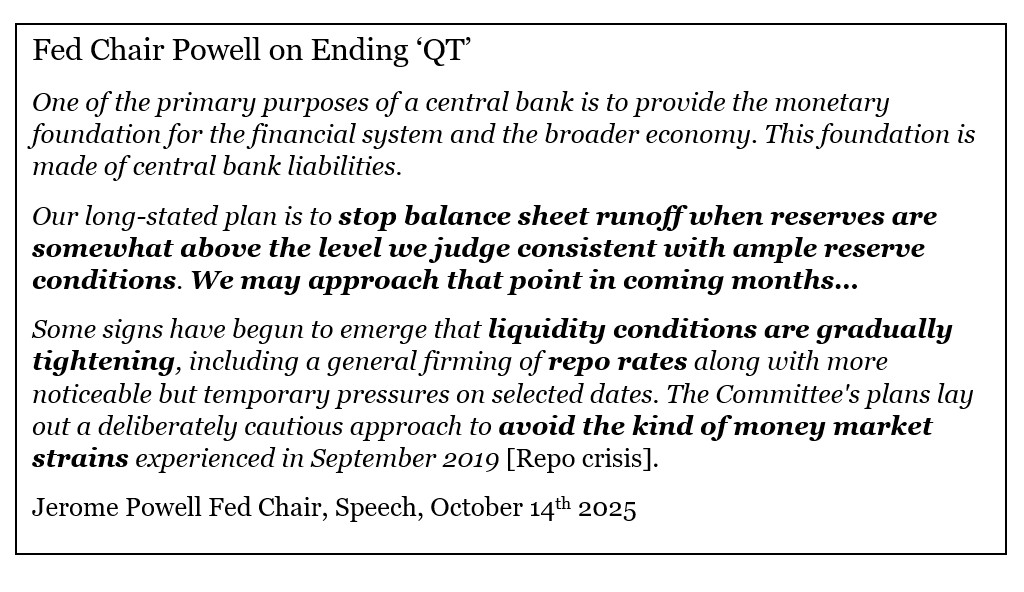
Global liquidity is key which is being boosted by Powell ending QT along with rates being lowered.
 In addition, China has injected roughly $1 trillion (8 trillion yuan) into its markets over the past year. China fears that stablecoins could enable capital flight and weaken state control. Indeed China's wealthy have moved well over the $50k maximum allowed through such vehicles. The People’s Bank of China (PBOC) is thus easing policy and devaluing the yuan against real assets like gold rather than the dollar, aligning with a long-term monetary retrenchment.
Sydney Homer’s book “A History of Interest Rates”, noted that in over 4,000 years of recorded history, zero or negative rates never appeared until the 2010s–2020s during the post‑GFC crisis and COVID era. Recent monetary policy has been unprecedented, which shows that governments have moved from rate cuts to permanent monetization as a default response to crises.
Today’s environment—the willingness for zero or negative interest rates, permanent monetization, global capital wars, and the simultaneous rise of gold, stocks, and crypto—is unprecedented in 4,000 years of monetary history. It is a new age of monetary debasement requiring hedging through hard assets like gold, stocks, bitcoin, real estate, and other scarcity-based stores of value.
If economies slow significantly despite AI spurring stagflation, policymakers could delay the liquidity contraction via rate cuts and QE, keeping liquidity elevated for longer and pushing asset market tops further into the future. However, inflation issues may ultimately limit this extension. That said, a new acceptable level of inflation seems to be above 2%. So not only does the inflation data get manipulated, the Fed also adjusts its mandate to changing times.
Falling precious metals
Both gold and silver sold off sharply primarily due to profit-taking, a stronger U.S. dollar, easing trade tensions, and technical overbought conditions following record rallies. In the week ending October 10th, gold and silver funds posted $8.2 billion in net inflows, the second largest inflow on record. This followed a record $9.5 billion seen in the prior week.
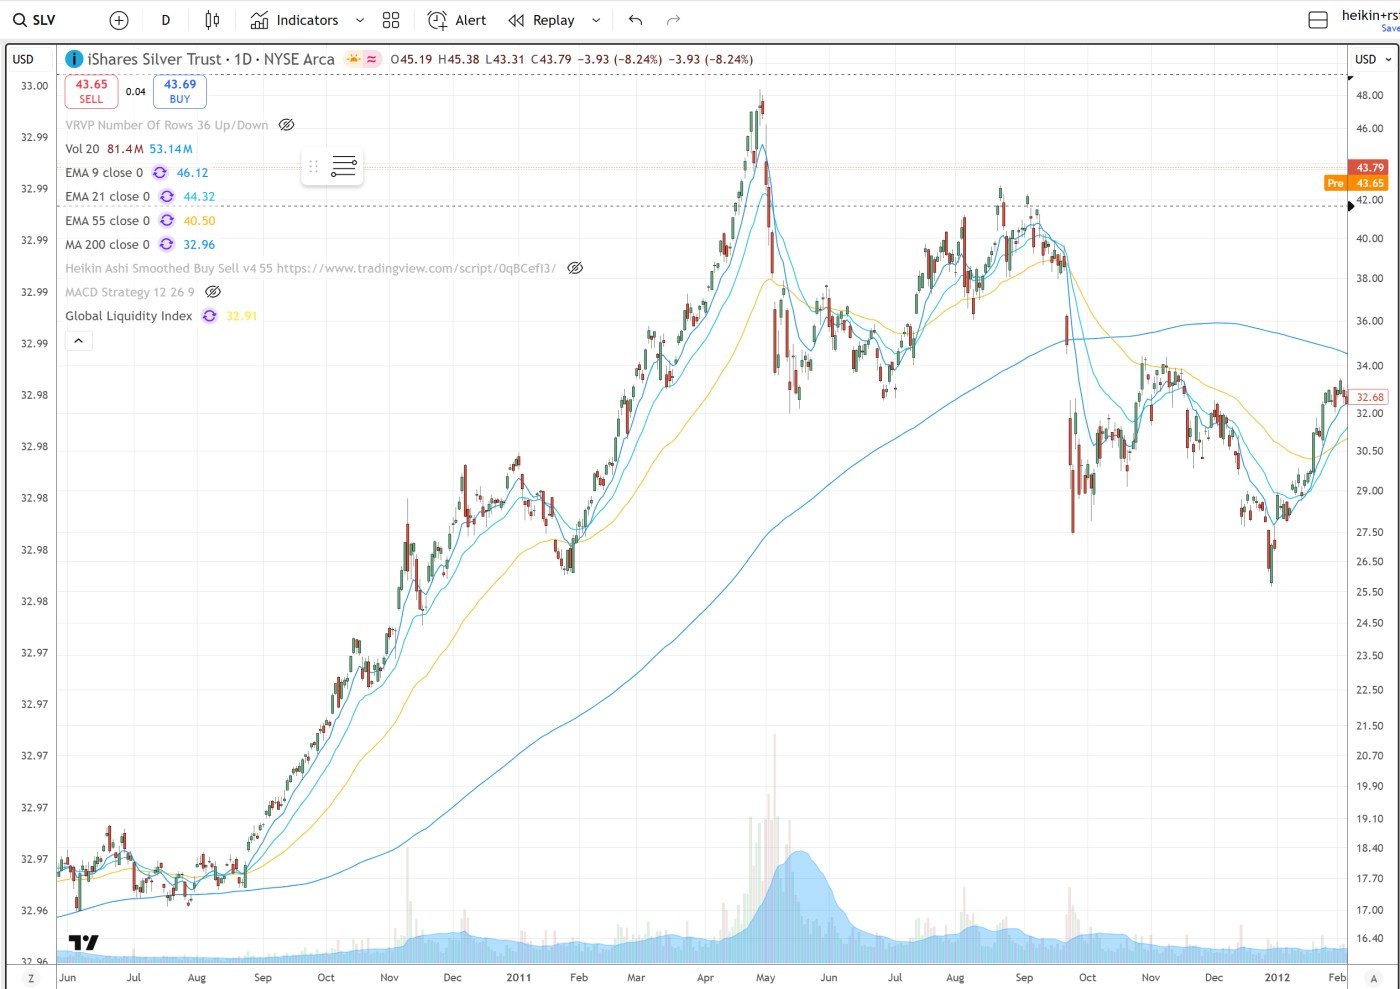
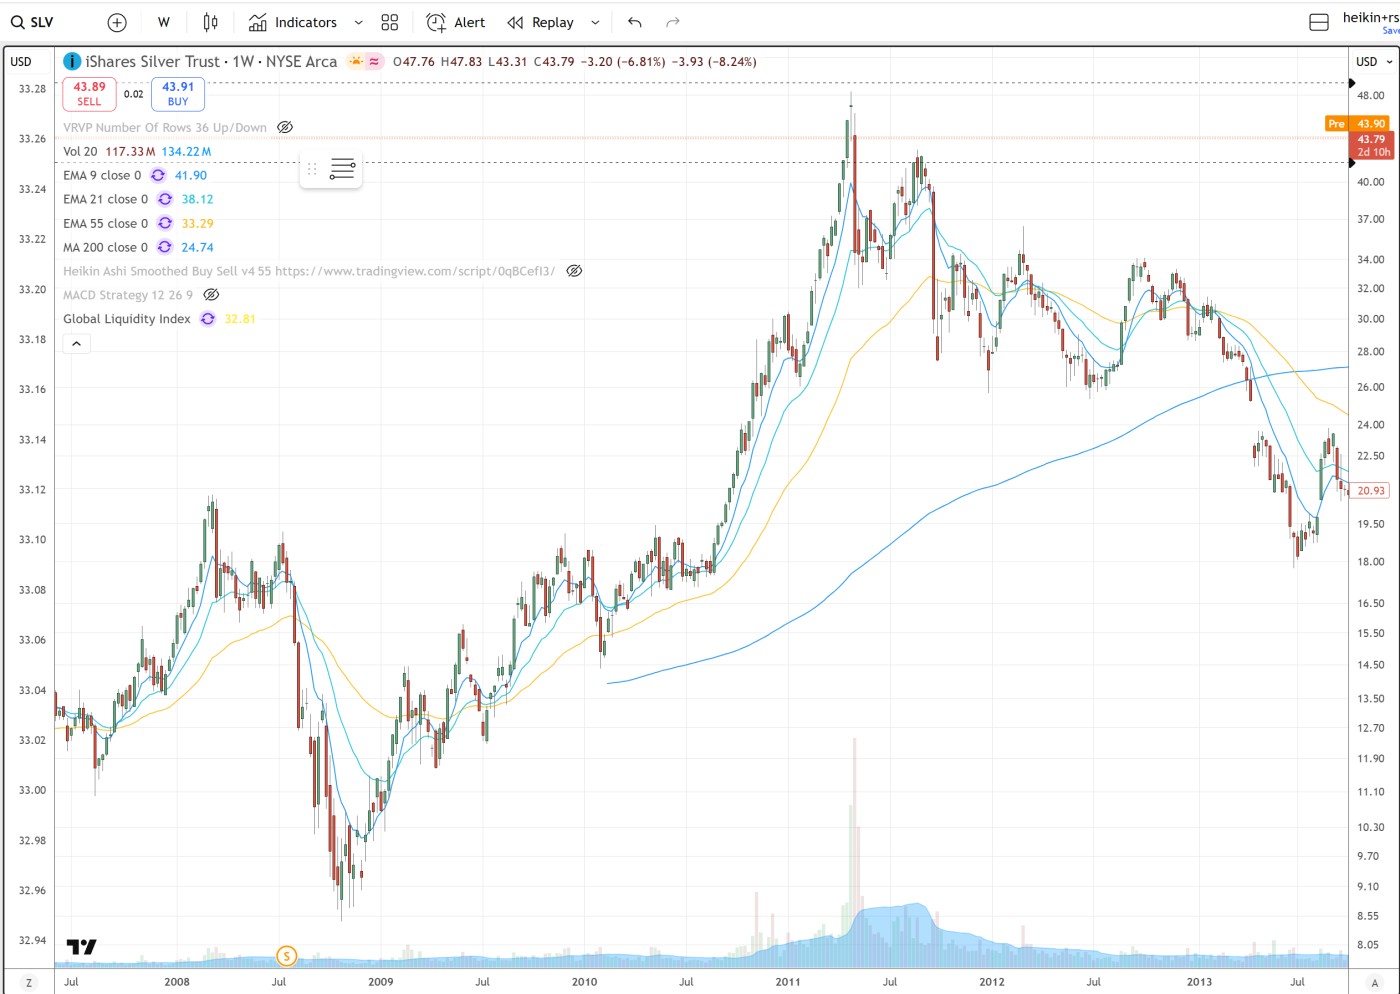
Silver has made a double top when looking back to 2011 which was the last time it had a major climax run. One should monitor price/volume action to see if silver stabilizes. If it has a steep correction as it did in 2011 when it fell from just over 50 to below 32 in two weeks on record volume, that could signal the end of the run in precious metals.
2011 top daily:
2011 top weekly:
Despite the sharp short-term drop, longer-term gold and silver fundamentals remain supportive due to ongoing geopolitical risks, central bank demand, debasement of fiat, and expectations of future rate cuts. Institutional capital continues to pile into gold while the flow of global liquidity remains robust.
The current drop seen in the chart below is less aggressive than in 2011 since we have had two up days since the peak, plus volumes have been lighter than the peak up volume day. By contrast, in 2011 in the daily chart above, selling volume was at record levels while silver sold off for five days straight.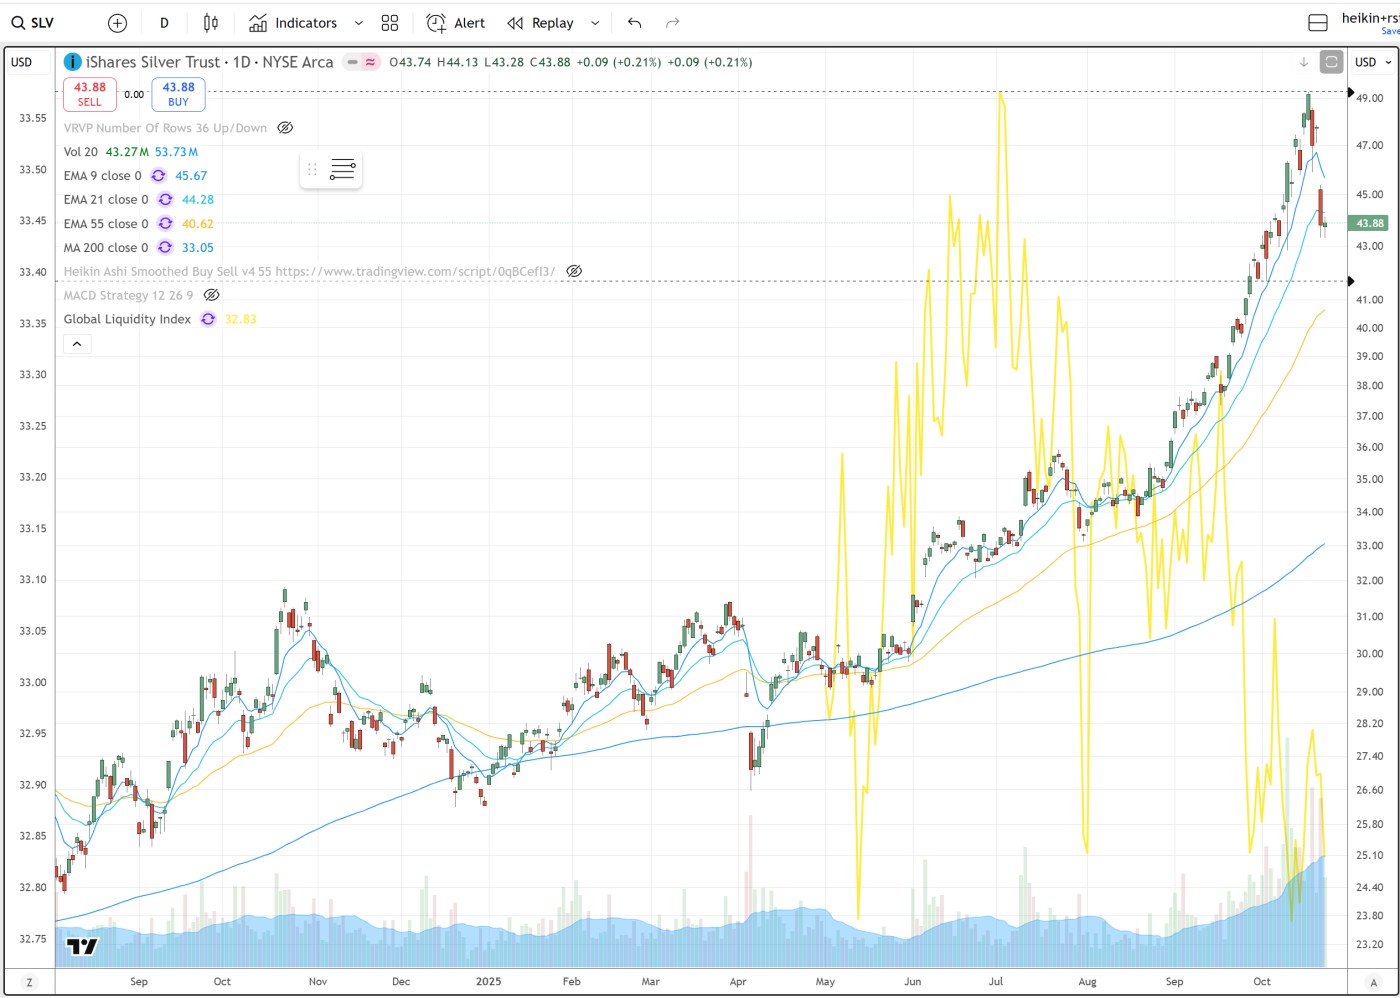
Bitcoin catches up to gold?
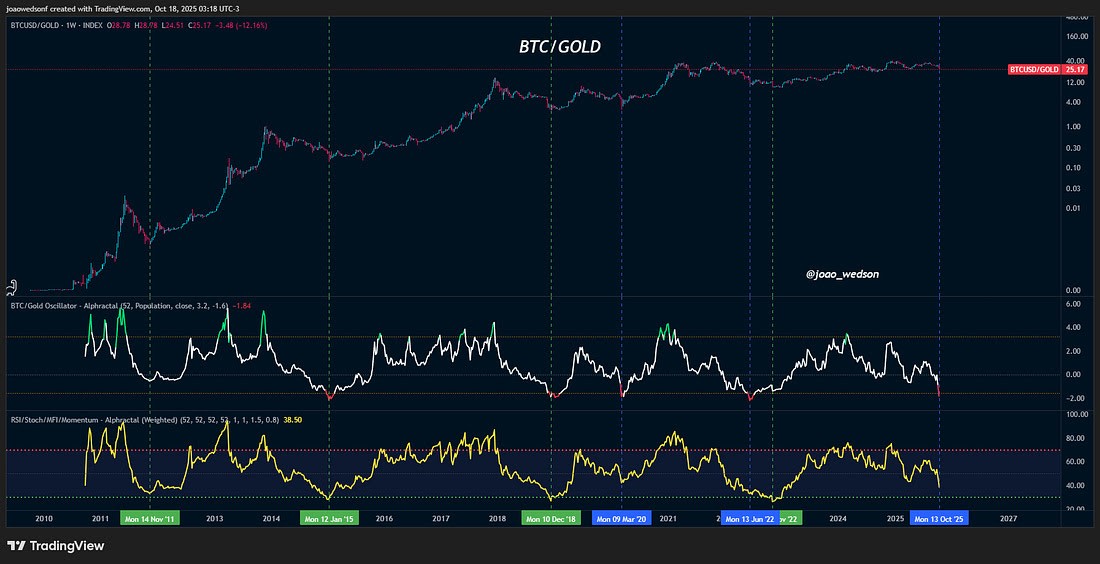
Central bank buying will also extend to bitcoin as the fight to preserve purchasing power intensifies. Global M2 money supply hit $140 trillion for the first time in history. Bitcoin can follow gold with a delay of about 3 months. Gold being risk-off reacts faster to macroeconomic events or investor sentiment shifts while bitcoin catches up after capital rotates or sentiment spreads to crypto markets.
As shown in the chart below, bottom signals in the BTC/Gold ratio are extremely rare, and they tend to appear during high-volatility moments and sharp BTC drawdowns, the latest due to blowups in the regional banking sector which spilled over into risk-on assets such as bitcoin.
The blue signal marks the current bottom. The green signal is even stronger. It shows up when both the BTC/gold oscillator and RSI/Stoch align at their lows. Historically those moments have been the best BTC/Gold opportunities ever recorded.
This suggests the risk-reward profile of bitcoin looks far more attractive as of now. That said, bitcoin could continue to trade sideways for a bit longer as it did after the blue signal on 13 Jun '22 as shown in the chart.