
Market Lab Report
by Dr. Chris Kacher
The Web3 Evolution Will Not Be Centralized™
Fiat currency debasement vs. Bitcoin and other cryptocurrencies
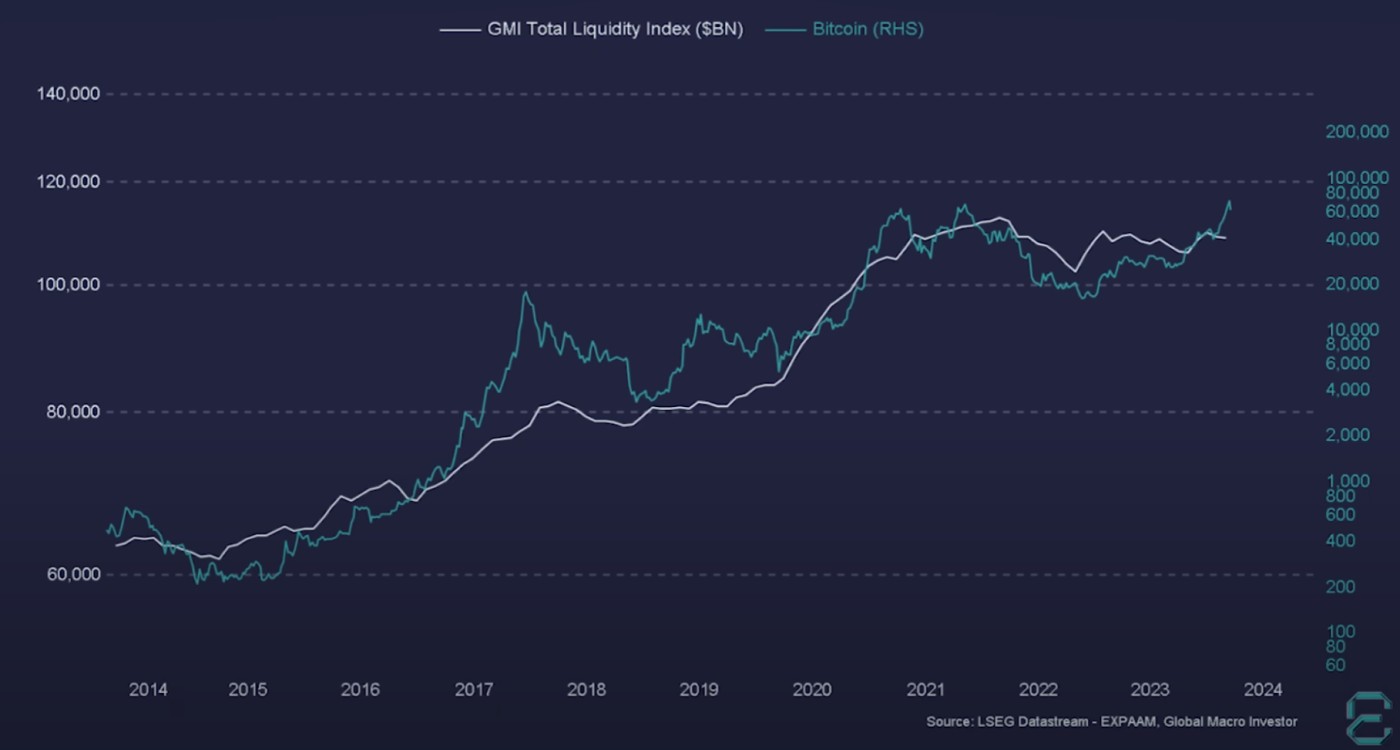
The GMI Total Liquidity Index offers a consolidated view of all major central bank balance sheets from around the world. You can see in the chart that most recently, there has been a recent downturn in global liquidity since the start of this year but this downturn should be short-lived. Nevertheless, while it continues to trend lower, this can stall stock and cryptocurrency markets because both thrive on liquidity. As Ray Dalio has said, it will take about $8 trillion a year to hold temperature increases at 1.5 degrees Celsius. The world cannot afford that. But it will nevertheless spend what it can therefore global liquidity is set to increase.
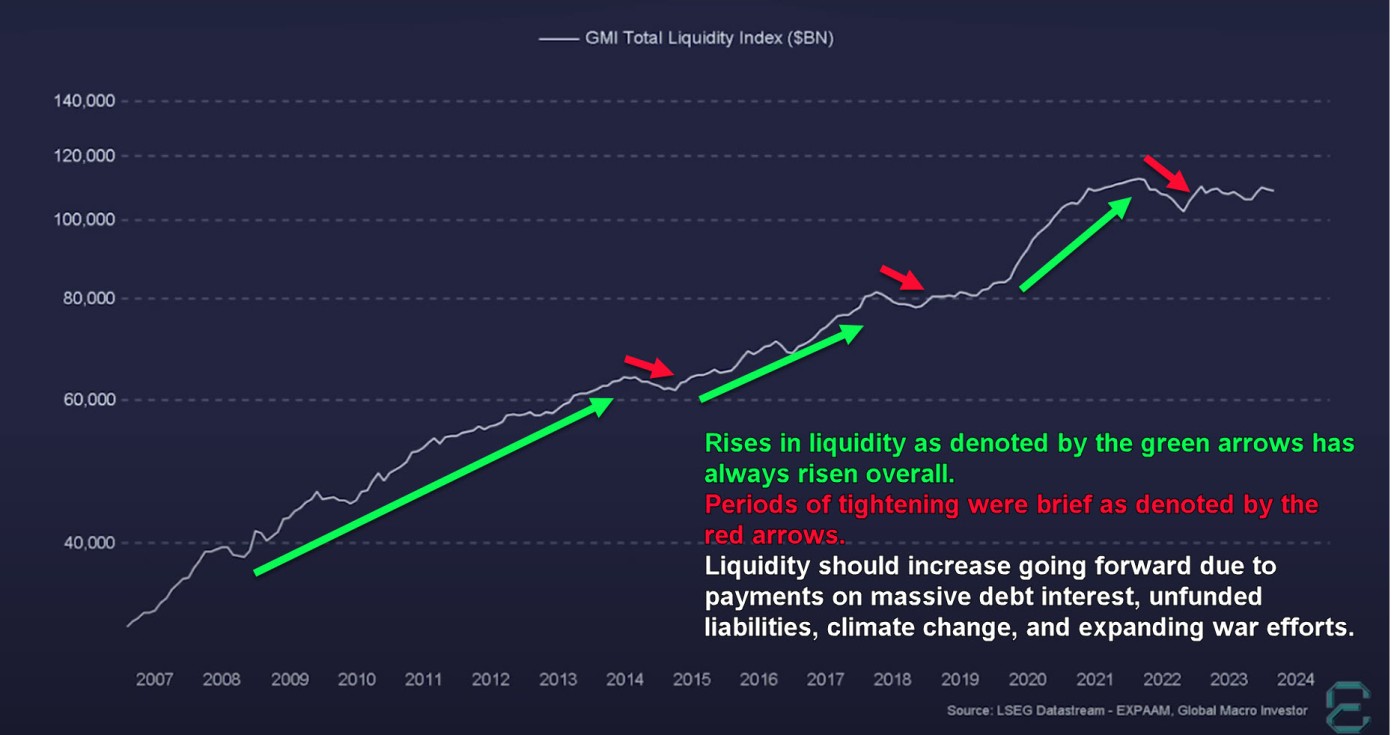
The yellow line represents GMI Total Liquidity:
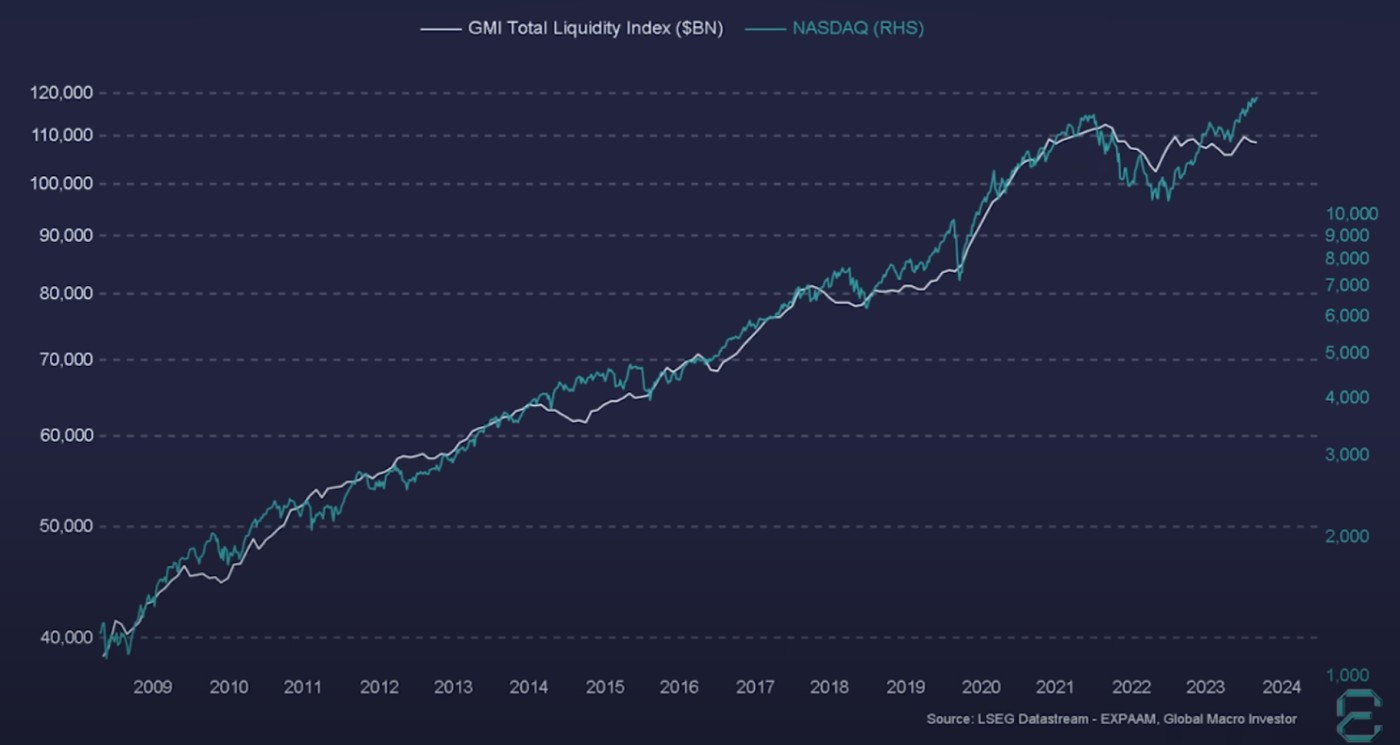
Over the long run since 2008, the NASDAQ Composite and Bitcoin both correlate highly with GMI.
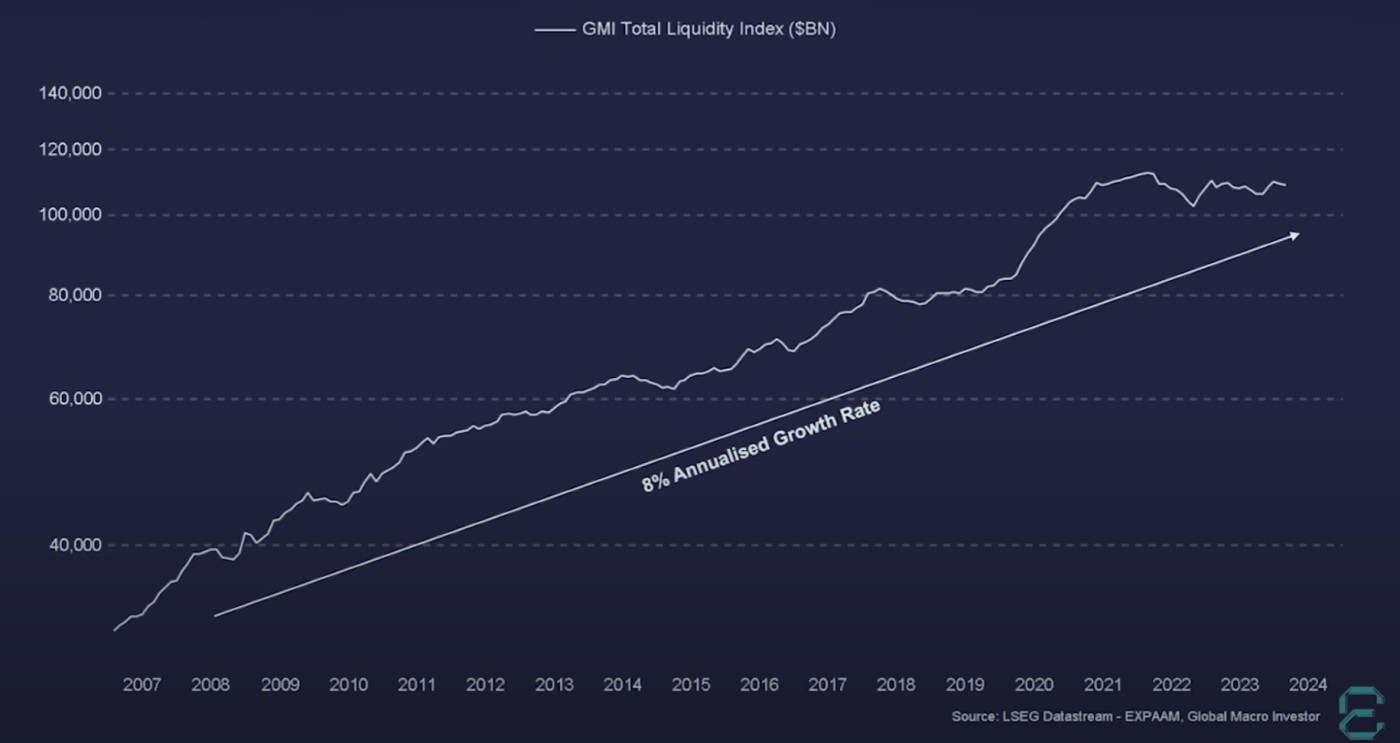
The GMI Total Liquidity Index has averaged an annualized growth rate of 8% since 2007. This is the trend of the debasement of currencies. Once you add in global inflation of about 4%, you have a 12% hurdle rate. You are basically getting poorer on a buying power basis if you dont average 12% a year. While the S&P 500 averages about 12% a year, this only keeps your spending power at par with fiat debasement. In other words, you are just staying in place. You are not getting richer in terms of buying power.
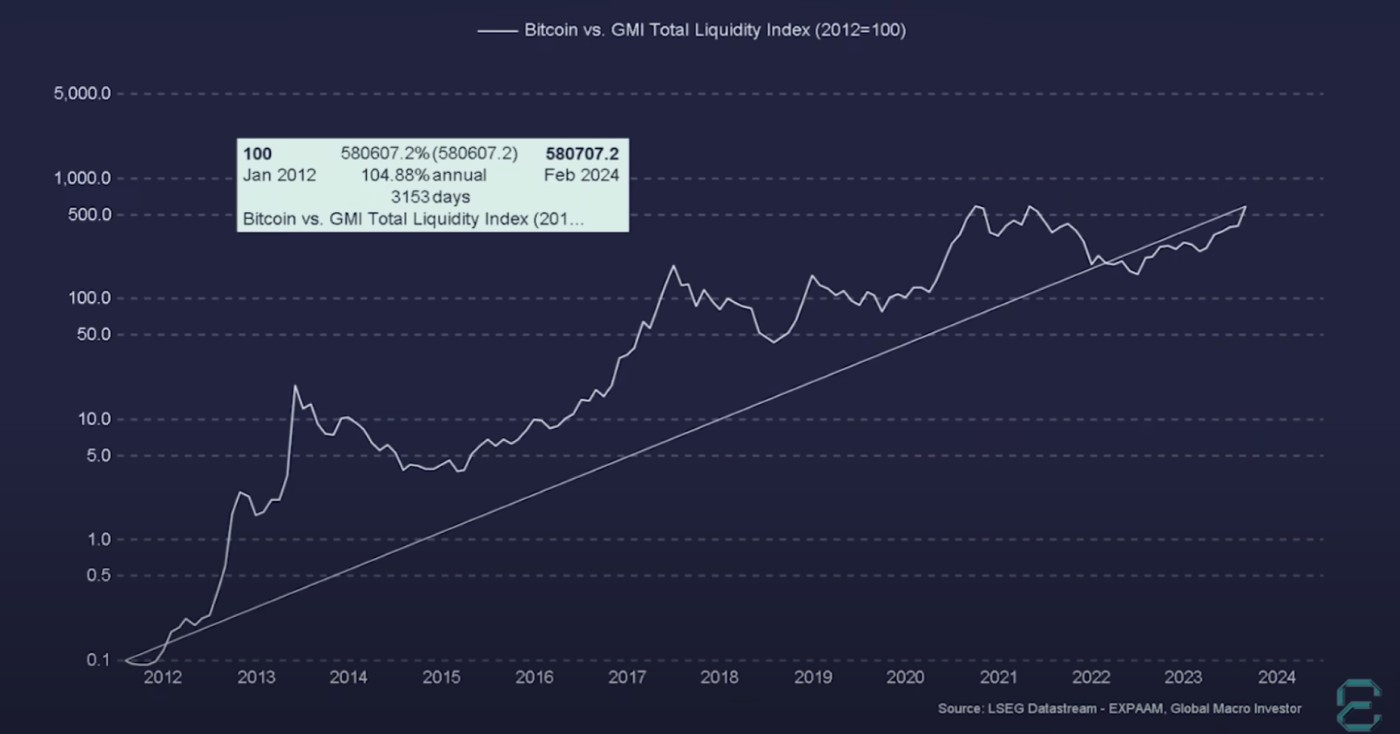
By contrast, Bitcoin has outperformed this currency debasement 12% hurdle rate by 104.88% a year since 2012, and even more since it was launched in Jan-2009.
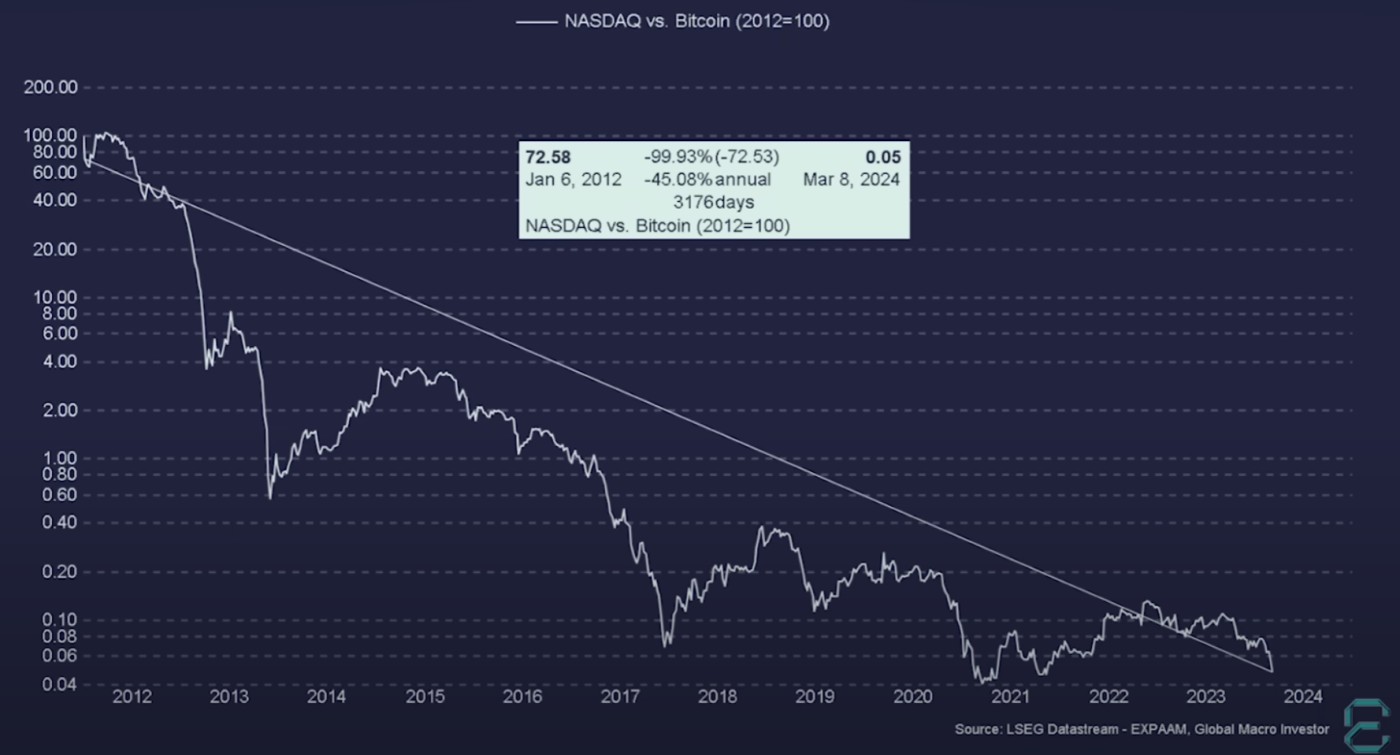
Over this same period, the NASDAQ Composite has underperformed Bitcoin by -99.93%.
Cryptocurrencies and Bitcoin are eating the world. You can see in the chart that if we take the year in which the number of internet and crypto users reached a million, crypto users have grown at 137% a year vs. the internet at 76% a year since then.
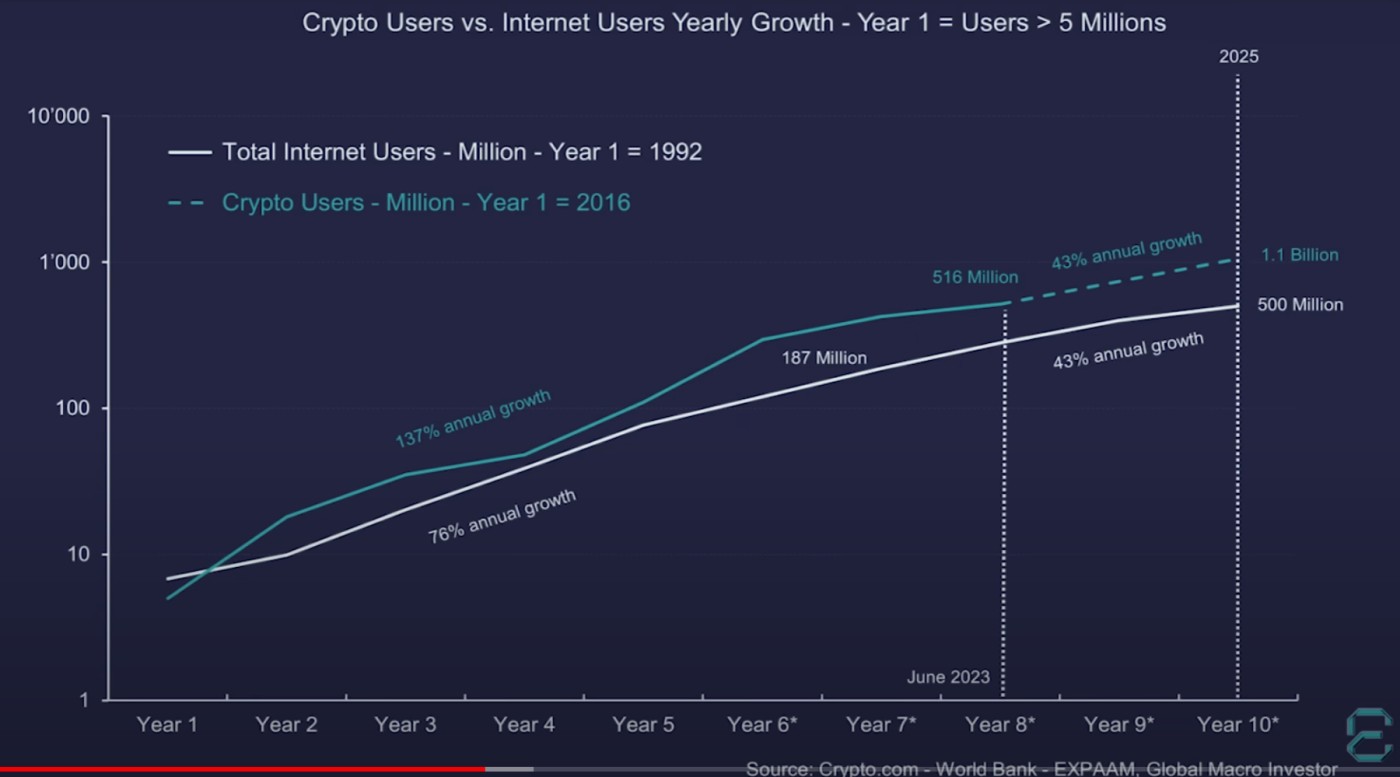
At this pace, about 4 billion people will be using cryptocurrencies by the year 2030, or half the world's population. The total valuation of cryptocurrencies would soar from $2.7 trillion where it currently stands to $12 trillion in the current cycle to $100 trillion within ten years. Expect a continuation of crypto as the fastest growth of an asset class in history. By contrast, the S&P 500 is worth $50 trillion. We are witness to a global wealth shock never seen before in history.
Global liquidity to increase again
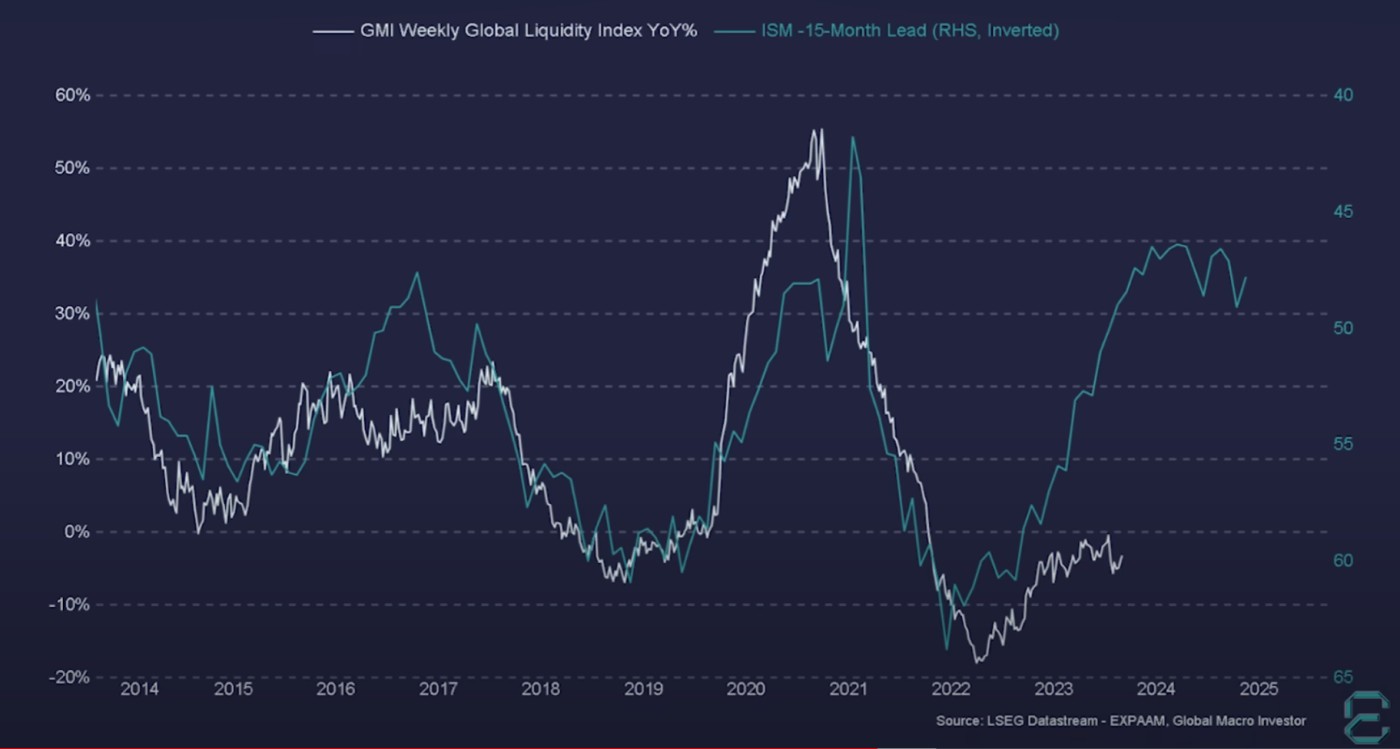
GMI total liquidity correlates highly with the ISM manufacturing index which measures business cycles by showing whether the manufacturing sector is growing or contracting. The ISM with a 15-month lead as shown by the green line keeps repeating every 4 years because of the debt refinance cycle which correlates with the US presidential election cycle. This is why commodities have done well this year in anticipation of a continued upturn in the business cycle which bottomed in 2022. The GMI Global Liquidity Index should therefore catch up with the ISM.
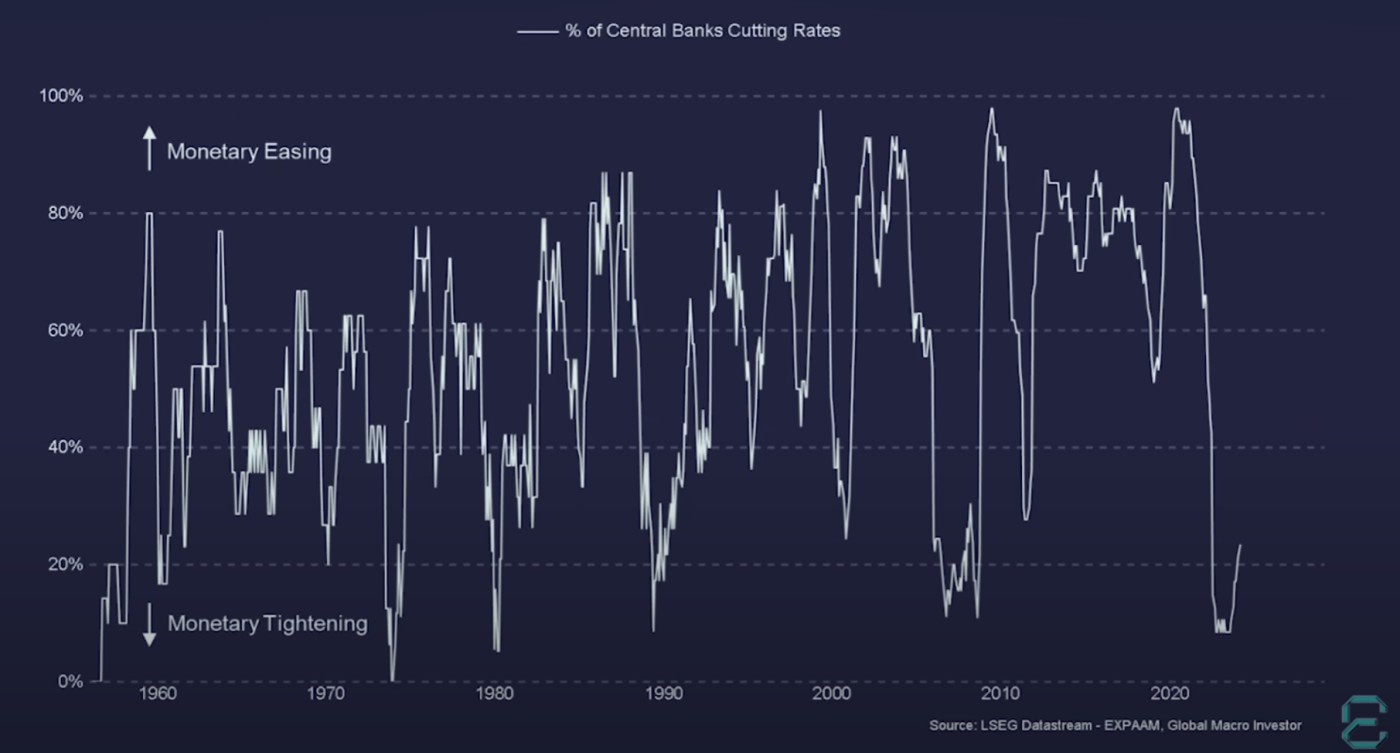
In addition, we are in an election year which tends to be favorable for additional liquidity. Bond yields are not coming down quickly, so how do governments pay the interest on all the bonds being created? Via QE and clever ways of accounting via Treasury General Account (TGA), among other methods. Governments will find ways of obscuring what they're doing which makes you poorer by way of clever forms of currency debasement.
Central banks look to be cutting rates though rates could stay higher for longer given sticky inflation. This would be akin to 1994 when rates were hiked six times sending markets lower, but then in 1995 after the seventh rate hike in Feb-1995, rates were only cut twice that year, cut once more in 1996, then stayed elevated for years. Markets thrived in this environment despite expectations that rates would be cut far more than just 3 times to offset the 7 times they were hiked.
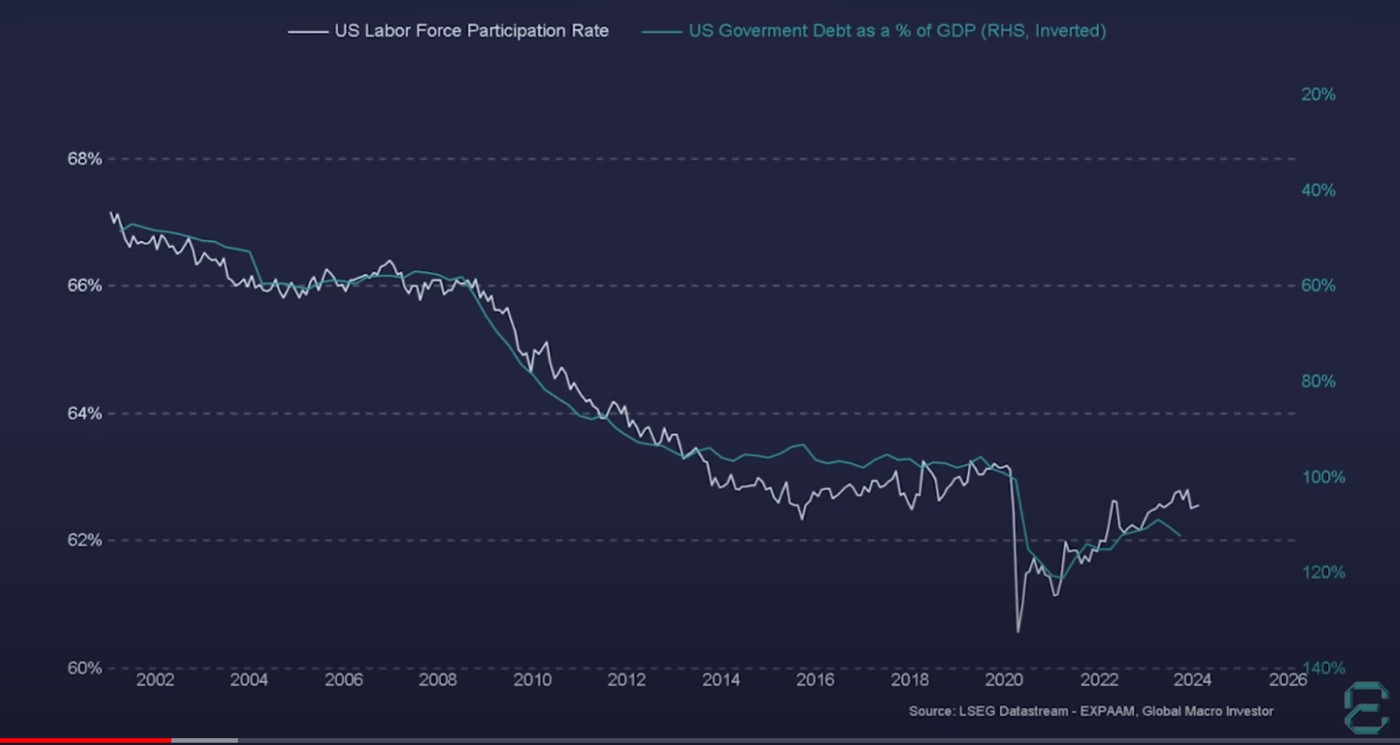
Another factor is the US labor force participation rate which has slowly declined since the year 2000 because we have a growing portion of retired people. This rate correlates highly with US government debt as a % of GDP. Demographics are key. As the workforce falls and the elderly population grows, additional funds must be allocated to the elderly. This is yet another reason why government debt increases over time, thus GMI total liquidity continues to rise over time.
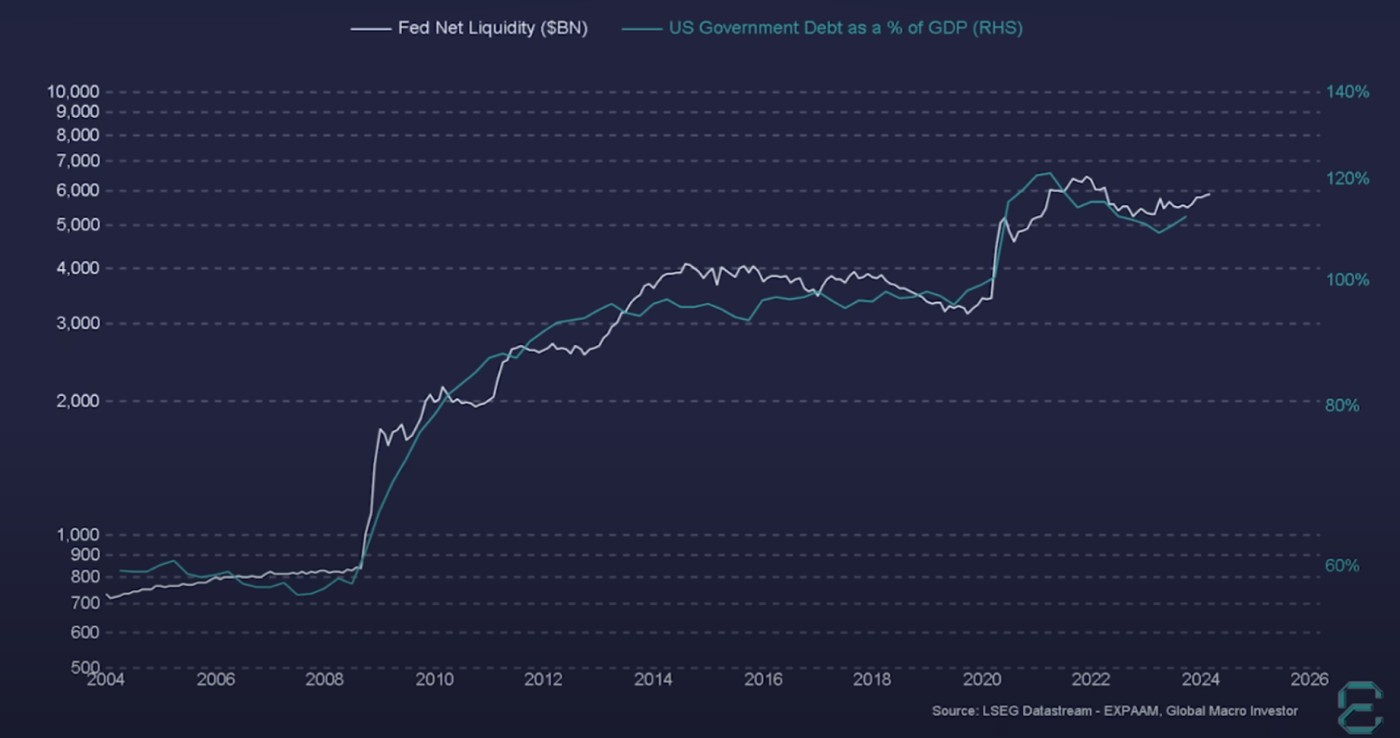
In consequence, since 2004, Fed net liquidity correlates highly with US government debt as a % of GDP.
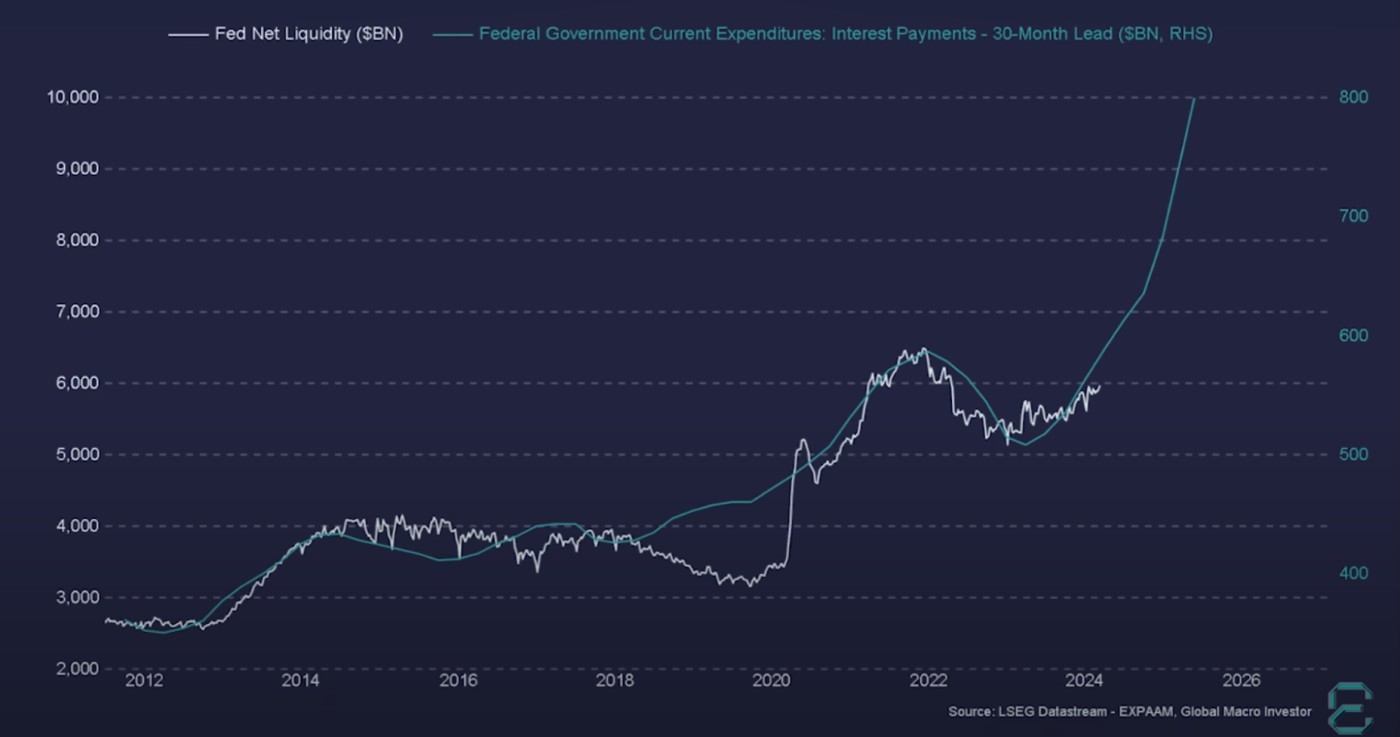
Fed net liquidity also correlates highly with debt interest payments. Due to the massive debt generated from COVID, debt interest payments are looking to soar. This suggests a huge increase in liquidity going forward.
What could go wrong?
Recession could hit, but then central banks would likely create bonds in a hurry to shorten the recession much as they did in 2008 and 2020. Interest rates would then drop fast.
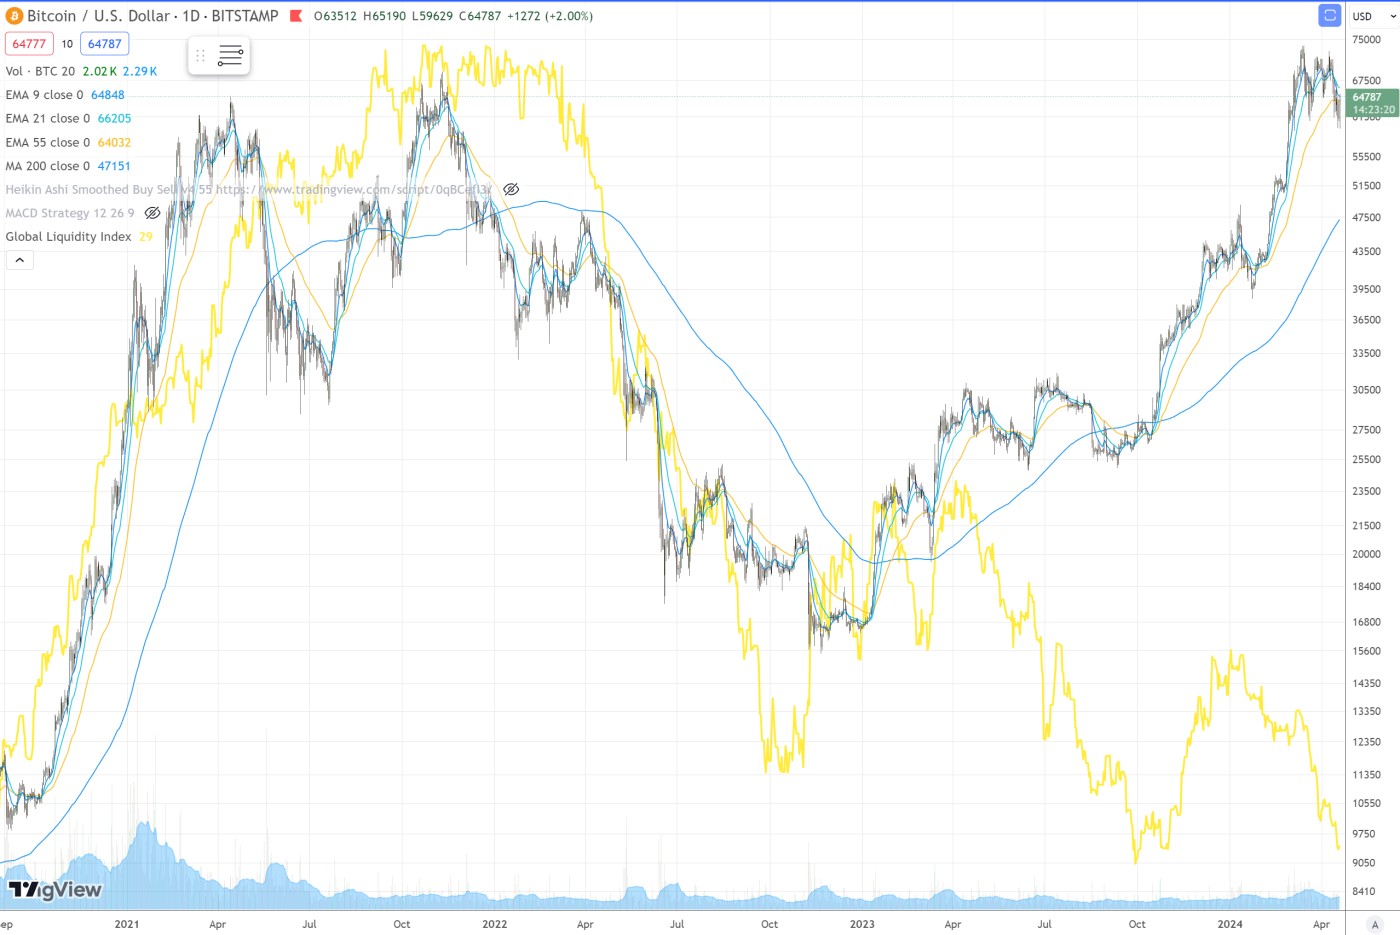
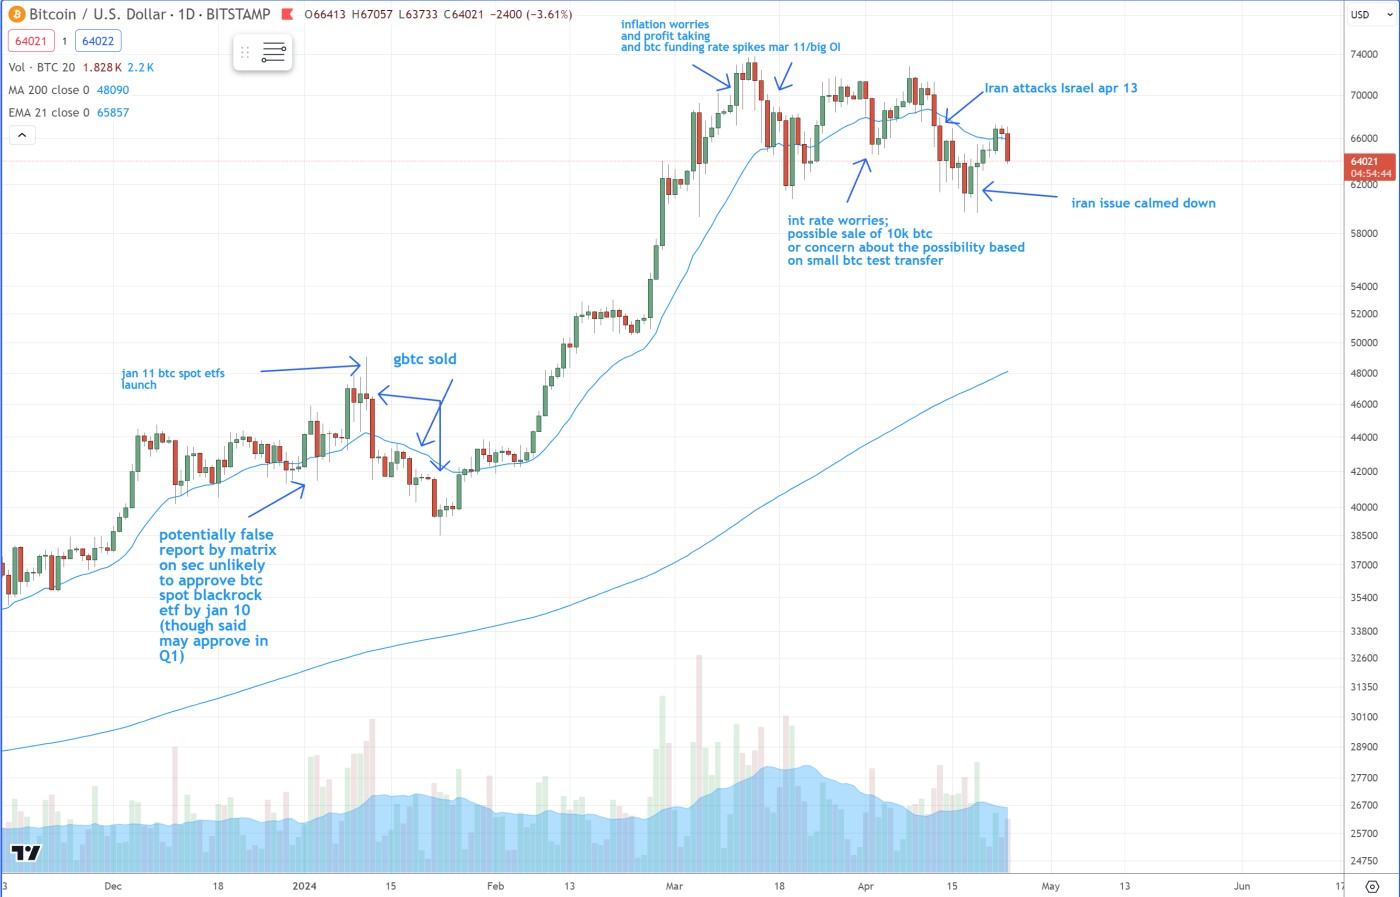
We also have the issue of sticky inflation which means interest rates will stay higher for longer. This has caused corrections in stocks and in Bitcoin. In my notes in blue below, OI is open interest. When Bitcoin funding rates spike, a minor top is near. In the chart below, we have seen the Iran-Israel conflict push Bitcoin lower as a potential double bottom forms but it has to clear its 55ema or its 50dma. Friday’s PCE will be telling.
What about Bitcoin offramps?
I have received a number of questions concerning the end of Bitcoin-to-fiat offramps. For crypto in the coming years, governments could try to ringfence cryptocurrencies such as Bitcoin and ban other cryptocurrencies. The US plans to call many cryptocurrencies securities. But the best ones would survive then thrive much as with the top internet stocks after the dot-com bust.
Crypto-to-fiat offramps could be banned in major countries to make way for central bank digital currencies (CBDCs). Still, it seems there would always be at least a handful of countries that enable this conversion because it would drive demand for their currency, then from their currency, one could convert to other fiats. So from an economic viewpoint, there should always be a way to convert BTC to fiat even if major countries ban offramps.
Perhaps governments could create a whitelist of allowed addresses (such as those run by Blackrock, Fidelity, etc) to transact BTC so one's personal BTC address would not be allowed into the ecosystem. In such a scenario, a secondary BTC market could emerge where Balaji's Network State comes into full form where no fiat exists, just BTC and crypto for value exchange, much as gaming currencies thrive in gaming ecosystems.
In the worst case scenario, the US could sanction those countries enabling crypto-to-fiat offramps, but again, it seems there would always be a market for such countries' fiat currencies into major fiat such as USD EUR etc. An underground market would thrive in such a case. But as discussed prior, in those countries that allowed such offramps, front end decentralized crypto-to-fiat exchanges would pop up driving big demand for their currency. If Pirate's Bay is any lesson, governments cannot stop such front end systems. For every Pirates Bay site that governments eliminated, ten new ones popped up. Illegal torrent file sharing of music, movies, books, and other media continues to thrive 30 years after governments shut down Napster for illegally sharing copyrighted music files.
All that said, it is more likely governments would allow BTC-to-fiat offramps as long as the Bitcoin address had passed KYC/AML.