Current Focus List
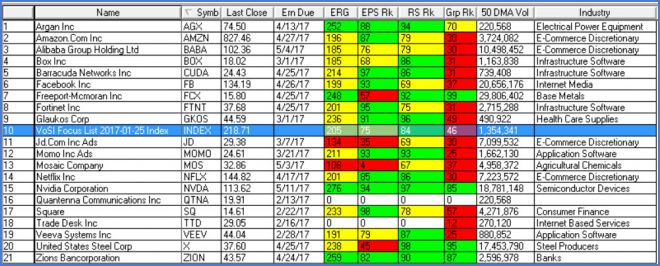
The VoSI Focus List is a compilation and reference list of stocks for which Pocket Pivot or Buyable Gap-Up Reports have been issued. It is not intended as a "buy list" or a list of immediately actionable recommendations. Stocks on the list may or may not be in proper buy positions, and investors should exercise discretion and proper judgement in determining when and where stocks on the Focus List can be purchased. The following notes are intended to assist in this process. Please note that members can enlarge the Focus List image by clicking on the body of the email and then holding the Control Key while pressing the "+" key until it is large enough to read.
General Observations:
All of the major market indexes, the Dow, the S&P 500 and the NASDAQ Composite, posted all-time highs on Friday as the market uptrend continues. Many are citing the high number of days that have passed since the market last had a 1% down day, as well as extremely high sentiment numbers reported by the Investors Intelligence Survey of Investment Advisers, as cautionary signs for the market. Our view is that investors should focus on the price/volume action of individual stocks. The market has maintained a highly rotational nature, so while some leaders may falter, money has generally rotated into other areas of the market. We would need to see a more concerted and broader breakdown in market leadership before drawing any exclusively bearish conclusions. Markets can often continue rallying even in the face of "extremes" in sentiment or even the number of days over which the market has not pulled back some specified percentage.
Removed from the List this Week:
Both Yelp (YELP) and Zillow (Z) were removed from the list this past week after gapping down and failing badly after reporting earnings. Again, we reiterate that holding stocks through earnings is extremely risky if one does not have a reasonable prior profit cushion. While it is possible to get lucky and see your stock gap-up after earnings (e.g., NFLX), holding a stock through earnings is tantamount to playing what we frequently refer to as "earnings roulette." Spin the wheel and take your chances.
Focus List Stocks Expected to Report Earnings this Week:
Quantenna Communications (QTNA) (2/13 AH) and The Trade Desk (TTD) (2/16 AH)
Notable Action:
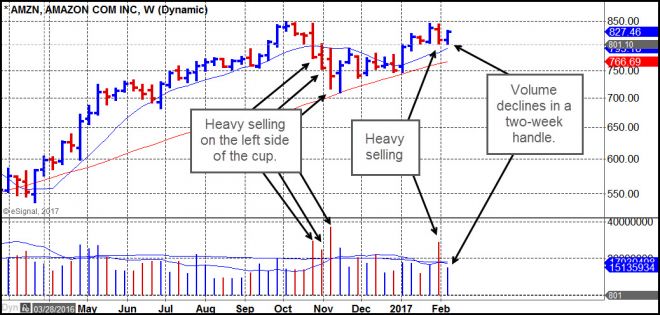
Amazon.com (AMZN) got hit with some heavy volume after earnings the week prior to this past week, and that shows up as a high-volume down week on the right side of a cup formation. This past week AMZN held well above its 10-week moving average as volume subsided. Note that the stock has seen some very heavy selling volume on the left side of the cup. It is now building what would be considered the second week of a handle in a cup-with-handle formation. So far the 10-week line would be considered a maximum selling guide, and the stock should be monitored closely to see whether it can build a constructive handle. The high-volume selling weeks with the base are somewhat cautionary, however, and on the daily chart the 20-dema would be considered a critical area of near-term support.
Technology juggernauts AMZN, FB, and GOOGL have been lagging the NASDAQ Composite and large cap NASDAQ-100. Nevertheless, should the market uptrend continue, expect these names to continue higher as well.
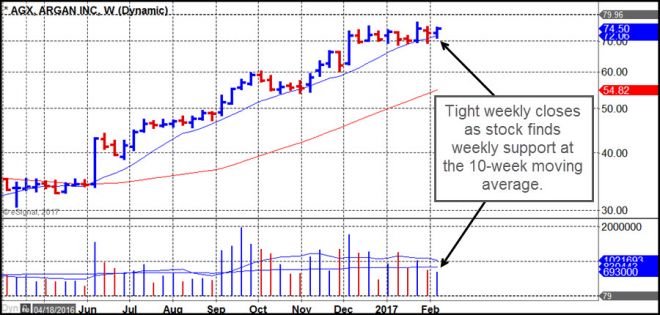
Argan (AGX) is holding very tightly in nine-week flat base. The past three weeks have seen tight weekly closes and support at the 10-week moving average. Buying on constructive weakness down to the 10-day or 20-dema lines is preferable, but so far the weekly chart looks quite constructive given that AGX has had a fairly substantial move since we first reported on its in early November.
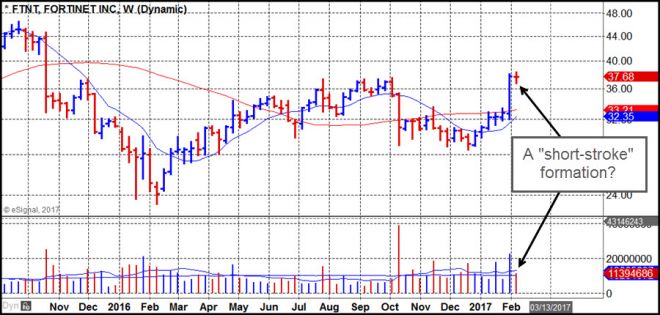
Fortinet (FTNT) has the look of the so-called O'Neil "Short-Stroke" pattern where a long upside price bar is followed by a very tight, narrow-ranged price bar with volume declining sharply. In our work, the Short-Stroke pattern is somewhat imprecise since it is usually formed by a buyable gap-up (BGU) followed by a tight flag formation on the daily chart. The weekly chart does not show the gap-up move and gives the false impression of a continuous upside price movement. Treating the pattern as a BGU instead of a so-called Short-Stroke is more precise in that we can use the 36.10 intraday low of the BGU day as a tight selling guide, whereas buying into a Short-Stroke pattern according to O'Neil-style rules would expose one to a 7-8% loss.
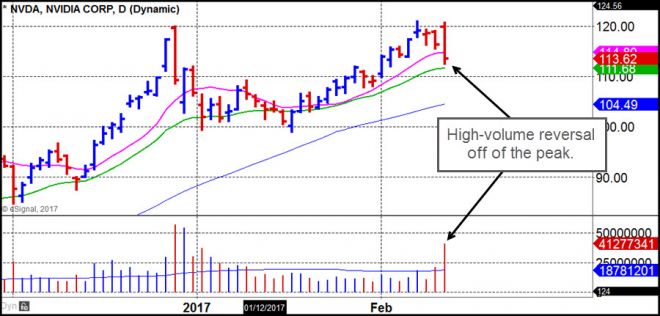
Nvidia (NVDA) looks to have formed a possible double-top formation as it got hit with heavy selling volume on Friday after gapping up slightly at the open following Thursday's after-hours earnings report. The stock closed just below the 10-day line on a high-volume outside reversal to the downside. This may be turning into a short right here, using the 10-day line as a guide for an upside stop. However, if the stock can constructively hold the 20-dema it may have a chance at forming an entirely new base. NVDA remains in flux, but our feeling is that any longs in the stock should be sold as we watch to see whether the stock can stabilize or whether it simply morphs into a short-sale target.
Square (SQ) is acting well ahead of its earnings report next week, expected on February 22nd. The stock has successfully tested and held its 50-day and 10-week moving averages on both the daily and weekly charts, and has now regained its 10-day moving average.
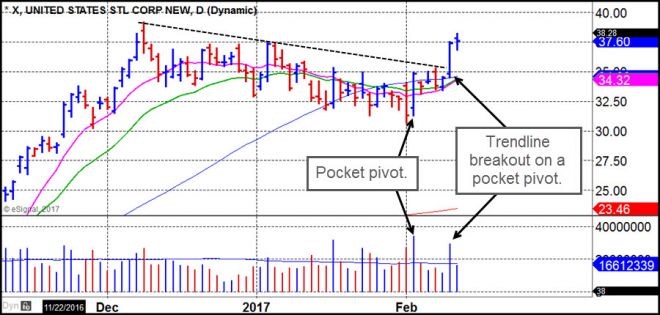
U.S. Steel (X) posted a big-volume trendline breakout on Thursday that also qualified as a pocket pivot. Note that X had a strong-volume pocket pivot seven trading days ago on the chart.