Market Lab Report / Dr. K's Crypto-Corner
by Dr. Chris Kacher
The Evolution Will Not Be Centralized™
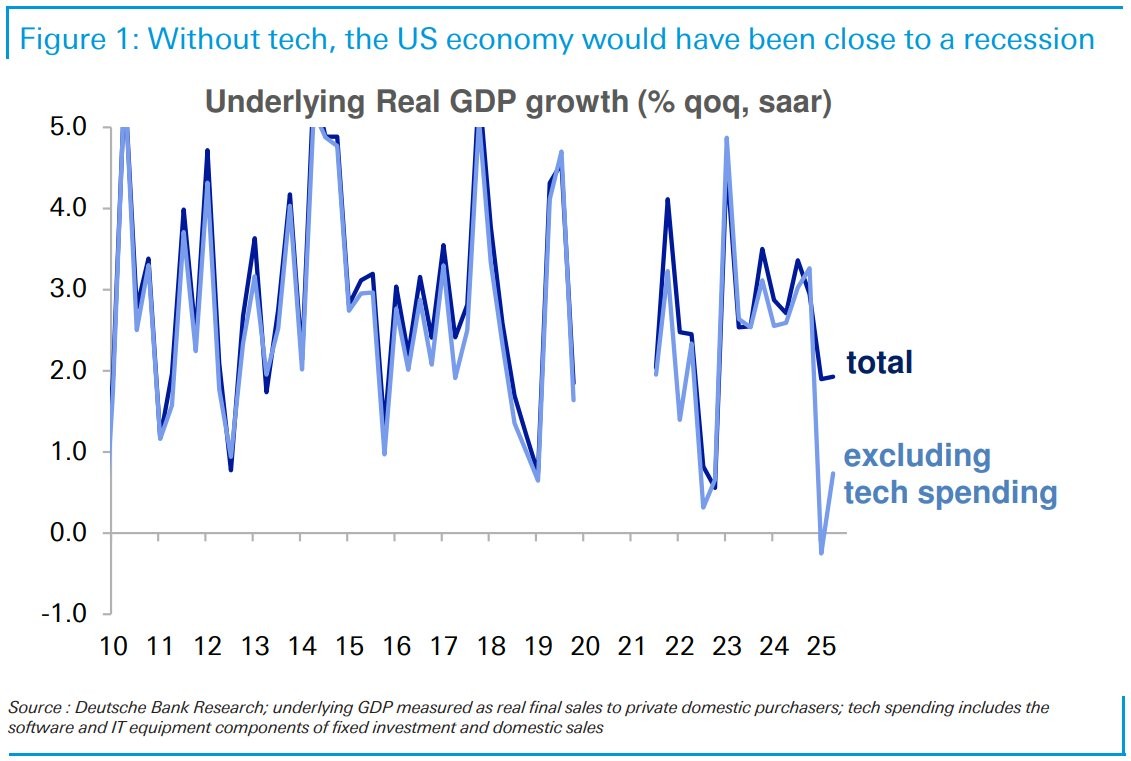
Without tech spending, the US would have been close to, or in, a recession earlier this year: Perhaps Nvidia, which employed only 36,000 people at the last update earlier this year, holds the keys to global macro in 2026.
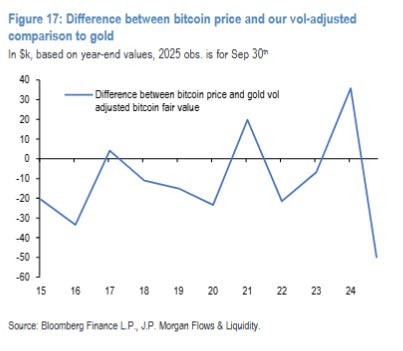
Meanwhile, central banks have been buying up gold in droves.
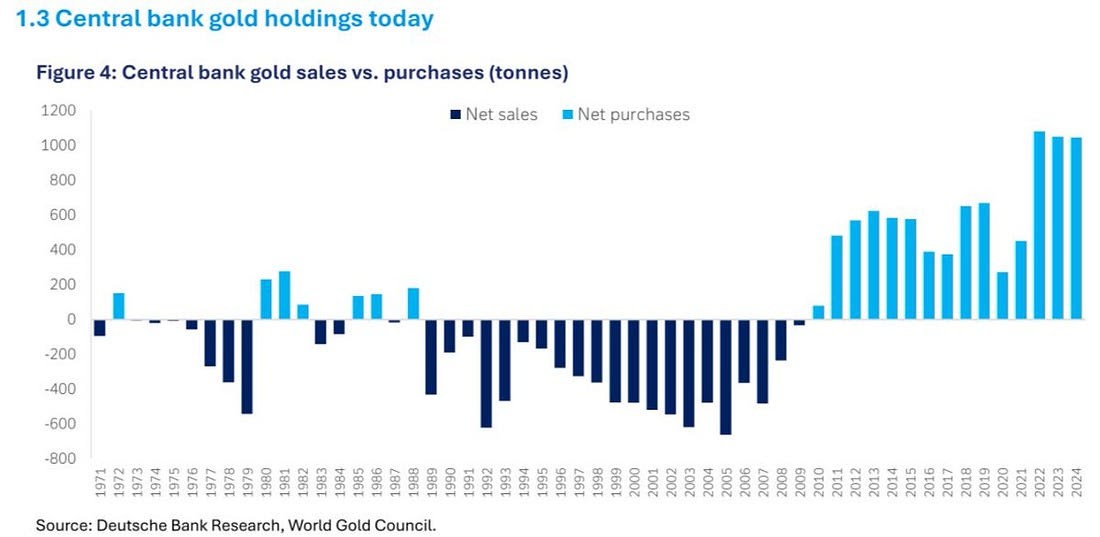
This central bank activity is about to help gold flip US treasuries as the most popular reserve asset around the world. It shows how a loss of confidence in US treasuries and fears about the global economy are making gold a winning trade.
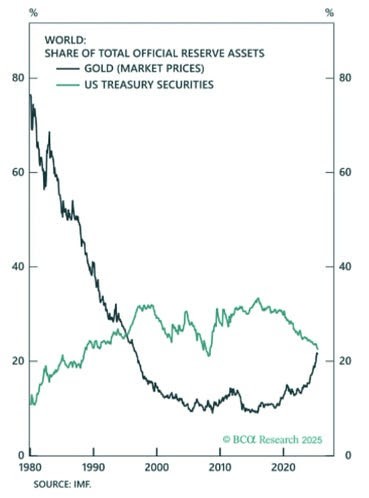
Bitcoin should follow as it tends to trade in a range relative to vol-adjusted gold. Further, it remains superior to gold for many reasons discussed in prior reports. Still, central banks' mandates remain conservative thus gold is the preferred choice... for now.
With markets hitting new highs since the April tariffs shock, and also in the years prior since the lows hit in late 2022, the doomsday predictors are not only wrong; they are cherry-picking data to tell a story that scares people out of the market.
Meanwhile, the strategy favoring gold and Bitcoin is being called the "debasement trade" by JP Morgan analysts.

Crypto inflows the omen?
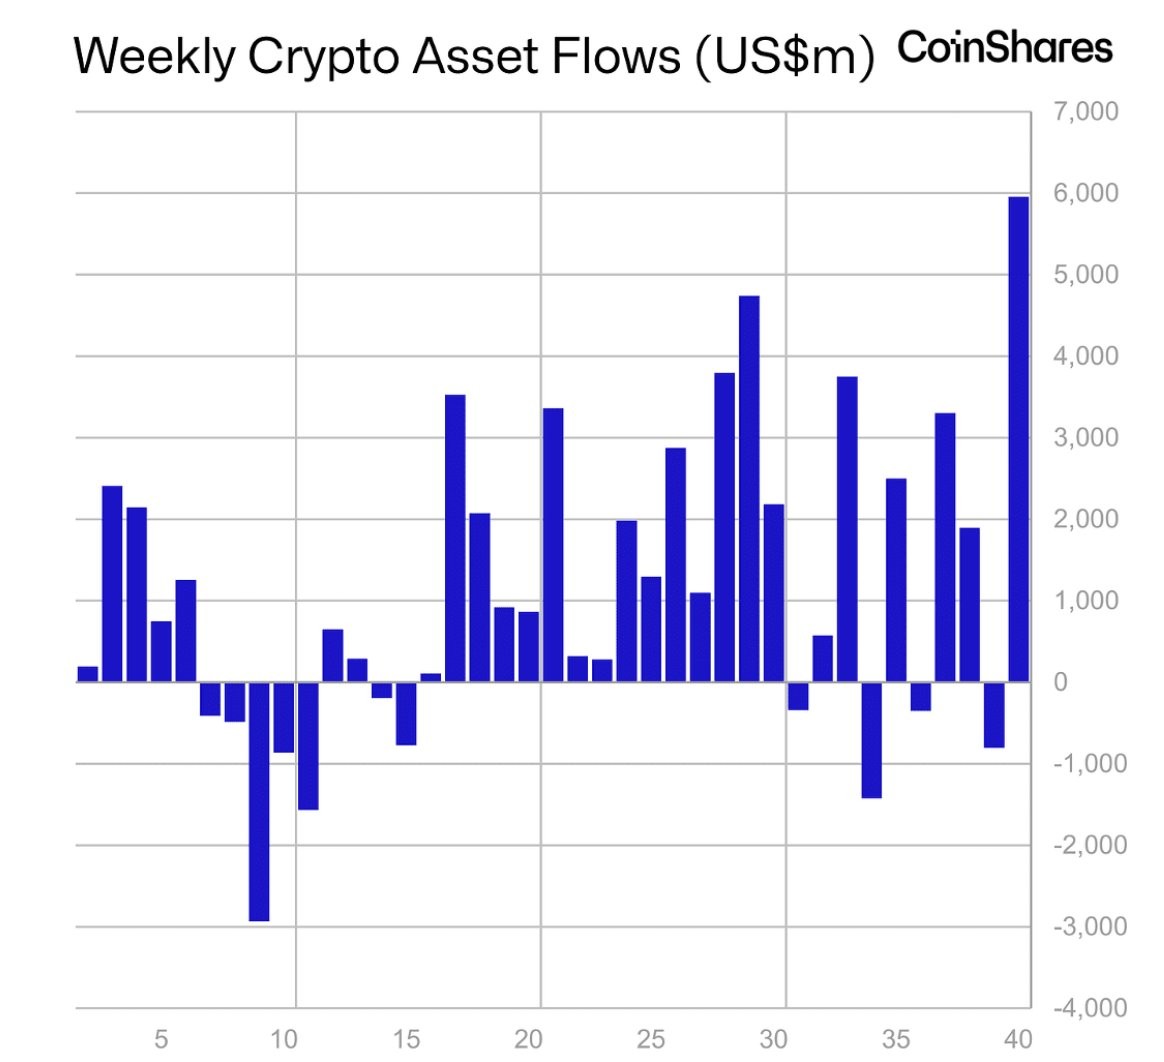
Big money is moving because confidence in the global financial system is starting to fray. Global growth is slowing, debt loads are exploding, and the risk of a major credit event, something breaking in the bond or banking system is rising fast. Under the system of capitalism, people can move their money to where will be treated best. First it was the individuals, then it was the small businesses and private companies, then the public companies, which were followed by the large financial institutions. Eventually we will see the central banks and nation states.\
Bitcoin miners go AI
As concerns bitcoin miners, since we put out reports on MARA and CLSK on September 20, both have soared in anticipation of integrating AI in their operations, much as other bitcoin miners have done. While CLSK still remains more of a pure play on bitcoin, it is assumed that it too is joining the AI club. Our best-performing long stock idea in the Summer of 2025 has been IREN Ltd. (IREN) for a 5-fold gain which began a sharp upside trend after shifting its business focus from crypto mining to data center AI infrastructure.
AI/cloud services now generate multi-hundred million annualized revenues for the most aggressive miners, and companies are redeploying large energy and GPU resources for AI workloads, offering up to 25 times the revenue per kilowatt-hour compared to traditional Bitcoin mining.
Leading bitcoin miners integrating AI can see stock prices move 2x or more from current 2025 highs, provided AI and HPC (high performance computing) demand continues to meteoric levels and operational execution remains strong. This sector is now among the highest momentum "AI-adjacency" trades in global equities.
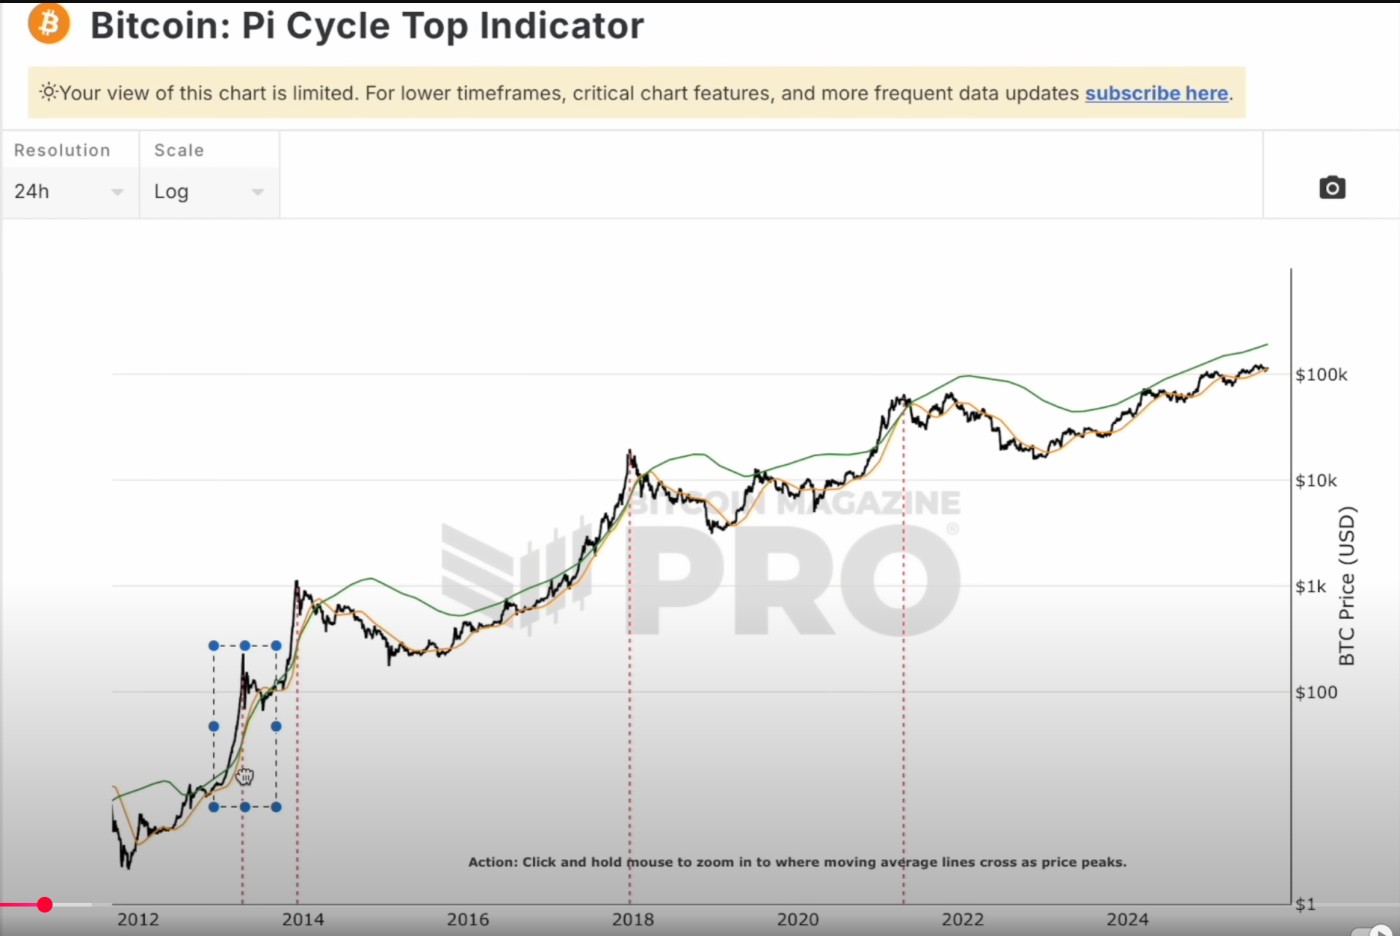
Spurring this continued uptrend is bitcoin which likely has more upside given its past history. It has yet to have a climax top which could come within the next 3-6 months. Climax tops in bitcoin have always been met with 20x or more price gains from its prior major lows. Bitcoin then typically corrects more than 2/3 to 3/4 from its top. Given that the cycles have become more compressed over the years, in the current case, we could see a potential upside of 231k (15x) to 308k (20x) from its prior major low of 15.4k in this cycle. That said, climax tops have exceeded 20x so if such were to occur, half a million is possible for bitcoin. Given that its price quickly falls by at least 50% within a few weeks, it would likely then quickly fall to below 250k then head lower as it formed its new base.
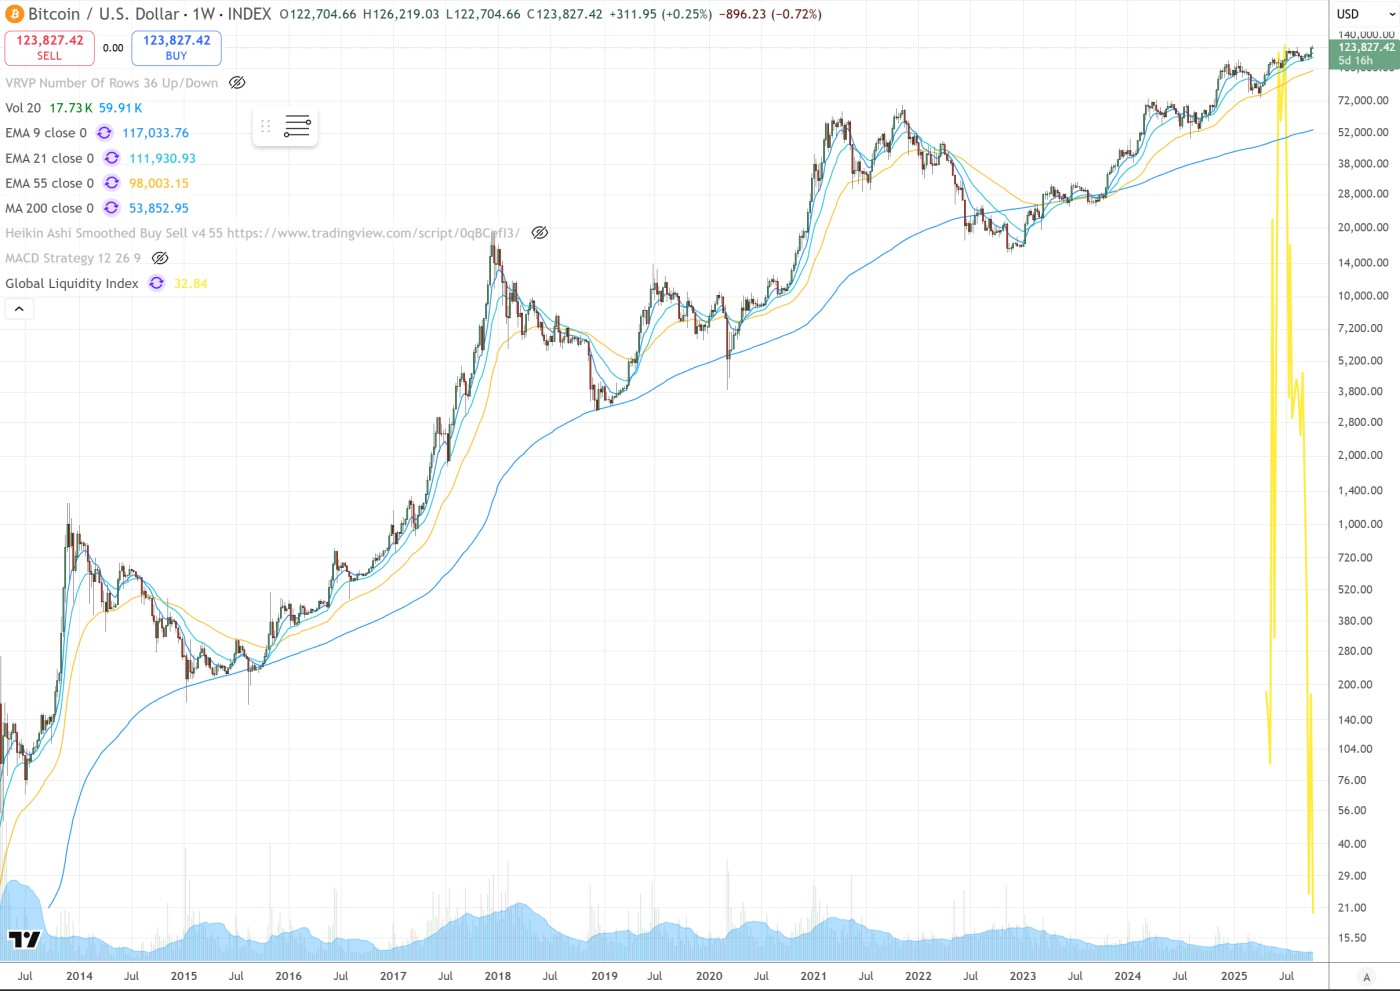
The Pi Cycle Top Indicator remains a respected and historically accurate tool for marking Bitcoin market cycle tops, having accurately predicted tops in 2013, 2017, and 2021 within a few days. However, as of mid-2025, it has not yet signaled a top, suggesting the current Bitcoin bull market may continue beyond expectations. Some expert analysis forecasts the next cycle top could occur as late as late 2026, with prices potentially reaching $395,000 to $400,000, rather than in late 2025, contrary to many popular predictions. Current projections also suggest a possible crossover signal near February 2026 at around $258,000 per Bitcoin, indicating that while the indicator is still considered valid, it may reflect an extended cycle this time since the cycles have slowed somewhat.