
GOLD & SILVER PRICE OUTLOOK: WHY GOLD CLIMBS & SILVER ACCELERATION IN 2026
GOLD RALLY DRIVERS: WHY PRICES KEEP CLIMBING
Five Primary Drivers
| Driver | Impact | Duration |
|---|---|---|
| 1. Safe-Haven Demand | Central banks (Russia, China, India, Turkey) accumulating reserves; structural shift from USD dominance; "de-dollarization" trend. | Long-term structural |
| 2. Weakening US Dollar | Dollar Index down 8% YTD; makes gold cheaper for foreign buyers; signals loss of confidence in USD as reserve currency. | 2025–2026 |
| 3. Inflation Persistence | US inflation stubbornly >2% Fed target for 4+ years; investors hedge via gold. | Ongoing |
| 4. Geopolitical Risk | Israel-Hamas conflict, Ukraine, trade war threats, tariffs; risk-off sentiment drives gold premium. | 2025–2026+ |
| 5. Rate Cut Expectations | Fed signaling 75 bps additional cuts 2026; lower real rates = higher gold demand (opportunity cost falls). | 2026 |
Result: All five drivers aligned; gold's bull run is structural + cyclical.morganstanley+3
GOLD PRICE FORECASTS (2025–2026)
| Institution | 2026 Target | vs. Dec 2025 | Basis |
|---|---|---|---|
| Bank of America | $4,400–5,000 | +8–23% | Central bank demand + rate cuts |
| Goldman Sachs | $4,525–4,900 | +11–20% | ETF inflows + structural CB buying |
| Morgan Stanley | $4,400 | +8% | Rally continues; 10% upside mid-2026 |
| Societe Generale | $5,000 | +23% | Bull case; most aggressive |
| Standard Chartered | $4,488 | +10% | Moderate; balanced scenario |
Consensus: $4,400–4,900/oz by end-2026 (+8–20% from current); base case $4,500.thestreet+2
WILL SILVER OUTPERFORM GOLD IN 2026?
Answer: YES — LIKELY
Silver is poised to beat gold's percentage gains in 2026, driven by mean reversion in the gold-silver ratio and industrial demand acceleration.devere-group+1
The Gold-Silver Ratio Story
Current State (Dec 2025)
| Metric | Value | Implication |
|---|---|---|
| Gold/Silver Ratio | ~80–82:1 | Silver extremely undervalued vs. historical average |
| Historical Average (1970+) | ~54:1 | Silver needs 32–50% MORE appreciation to reach mean |
| Extreme High (2020 COVID) | 125:1 | Current near second-highest extreme in 40 years |
| Bull Market Compression (1980, 2011) | 15–30:1 | When sentiment shifts; silver → 200%+ gains |
Interpretation: At 80–82:1, silver is statistically and historically undervalued. Mean reversion almost inevitable in 2026.cmegroup+3
Reversion Math: How Much Could Silver Rise?
If gold stabilizes at $4,500 and ratio compresses to historical mean:
| Target Ratio | Implied Silver Price | Gain from $31/oz |
|---|---|---|
| 60:1 (historical average) | $75/oz | +142% |
| 45:1 (bull market) | $100/oz | +223% |
| 40:1 (strong bull) | $112.50/oz | +263% |
| 30:1 (2011 peak) | $150/oz | +384% |
Base Case (60:1): Silver reaches $75/oz (+142% vs. gold +10%).truegoldrepublic+2
Silver Price Forecasts (2026)
| Institution | 2026 Target | vs. $31/oz Now | Rationale |
|---|---|---|---|
| Citigroup | $43/oz (near-term) | +39% | Supply deficit; sticky supply |
| UBS | $42/oz | +35% | ETF inflows + industrial demand |
| Bank of America | $65/oz | +110% | "Overshoot potential" on ratio compression |
| WisdomTree | $45/oz | +45% | Conservative; industrial support |
| Macquarie | ~$50/oz+ | +61%+ | Ratio compression to 83:1 |
| CoinPriceForecast | $70–95/oz | +126–207% | Aggressive bull; range scenarios |
Consensus: $42–65/oz by end-2026 (+35–110%); base case $50/oz (+61%).economictimes+2
GOLD VS. SILVER: WHICH BEATS?
Performance Comparison (2026)
| Metric | Gold | Silver | Winner |
|---|---|---|---|
| Expected Appreciation | +8–20% | +35–110% | SILVER |
| Risk Profile | Lower volatility (9%) | Higher volatility (19%) | Gold (safer) |
| Upside Ceiling | $5,000/oz | $75–150/oz | Silver (higher %) |
| Supply Dynamics | Stable | 5-yr structural deficit | Silver (supportive) |
| Industrial Demand | Minimal | Solar panels, electronics, AI (growing) | Silver (stronger) |
Winner 2026: SILVER — Expected to gain 2–4x more than gold on ratio compression + industrial demand.cmegroup+2
KEY CATALYSTS (2026)
| Catalyst | Timing | Impact |
|---|---|---|
| Federal Reserve rate cuts (75 bps) | Q1–Q2 2026 | +$50–100/oz gold; +$8–15/oz silver |
| China/India gold hoarding | Ongoing | Sustains $4,400+ floor |
| Solar/AI chip demand surge | H1–H2 2026 | +$5–10/oz silver (industrial) |
| Ratio compression begins | Q1–Q2 2026 | Silver +5–10% faster than gold |
| Geopolitical shock (tariffs, conflict) | Unpredictable | +$200–400/oz gold; +$15–25/oz silver |
BOTTOM LINE
Gold Climb Drivers: Safe-haven demand (central banks), weak dollar, persistent inflation, rate cuts = structural bull. Target $4,400–4,900/oz (2026) = +8–20% upside.
Silver Outperformance: Gold-silver ratio at 80:1 (near-extreme undervaluation); mean reversion to 60:1 = silver +142%+ in 2026 vs. gold +10–20%. Industrial demand (solar, AI chips) provides additional floor.
Never buy extended. Wait for silver to pull back to an area of support. In the current case using SLV as the proxy for silver, that would be its 10dma at the very least.
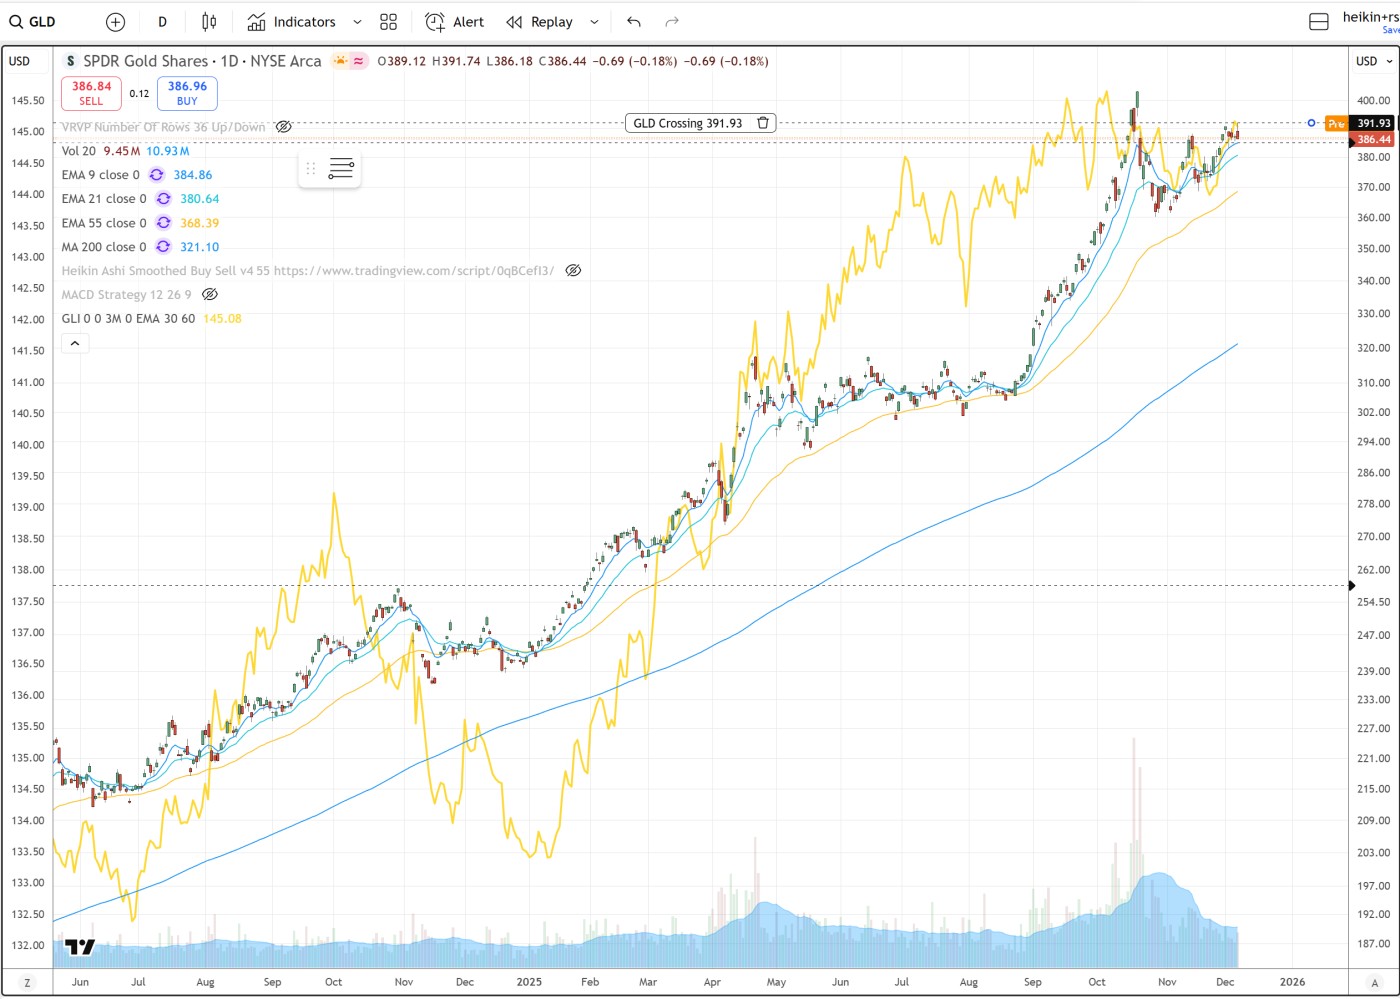
For gold using GLD as its proxy, that would also be its 10dma.
For other precious metals stocks, members have been sent regular reports on actionable buy points for each.
- https://economictimes.com/news/international/us/gold-prices-highest-in-2025-since-1979-whats-behind-the-rally-and-what-to-expect-next/articleshow/124469729.cms
- https://www.cmegroup.com/openmarkets/metals/2025/Six-Reasons-Gold-is-Soaring-this-Year.html
- https://www.morganstanley.com/insights/articles/gold-price-forecast-rally-into-2026
- https://www.goldmansachs.com/insights/articles/gold-forecast-to-rise-by-the-middle-of-2026
- https://www.thestreet.com/investing/goldman-sachs-exec-shares-eyebrow-raising-gold-price-forecast-for-2026
- https://www.reuters.com/business/finance/bofa-hikes-gold-price-forecast-5000oz-2026-2025-10-13/
- https://www.devere-group.com/silver-price-forecast-to-outshine-gold-in-2026-analysts/
- https://www.truegoldrepublic.com/blog/silvers-hidden-potential-decoding-the-gold-silver-ratio-and-why-silver-is-poised-for-a-historic-breakout
- https://www.cmegroup.com/education/lessons/gold-and-silver-ratio-spread-trade.html
- https://www.cmegroup.com/education/courses/understanding-futures-spreads/gold-and-silver-ratio-spread-trade.html
- https://rush.gold/understanding-the-gold-silver-ratio-as-an-investment-tool/
- https://goldsilver.com/industry-news/video/why-silver-is-undervalued-the-case-for-a-201-gold-silver-ratio/
- https://economictimes.com/markets/commodities/news/bofa-hikes-golds-2026-target-to-5000-sees-silver-testing-65-but-with-this-caution/articleshow/124529215.cms
- https://www.reuters.com/business/bofa-lifts-2026-gold-forecast-5000oz-sees-silver-65-2025-10-13/
- https://www.perplexity.ai/finance/GCUSD
- https://uk.finance.yahoo.com/news/3-reasons-why-gold-prices-050700894.html
- https://www.chards.co.uk/gold-silver-ratio
- https://www.reuters.com/business/hsbc-raises-silver-price-outlook-gold-strength-geopolitical-risks-2025-08-08/
- https://etfdb.com/gold-silver-investing-channel/analysts-predict-gold-silver-gains-2026/
- https://coinpriceforecast.com/silver
- https://economictimes.com/news/international/us/gold-silver-platinum-price-forecast-will-precious-metals-continue-to-rise-or-fall-back-heres-complete-price-analysis-current-trends-price-outlook-mining-stocks-and-market-indicators-blow-off-top-and-possible-price-correction-inflation-currency-weakness-industrial-demand/articleshow/124646011.cms