
by Dr. Chris Kacher
AI: Bulls vs Bears
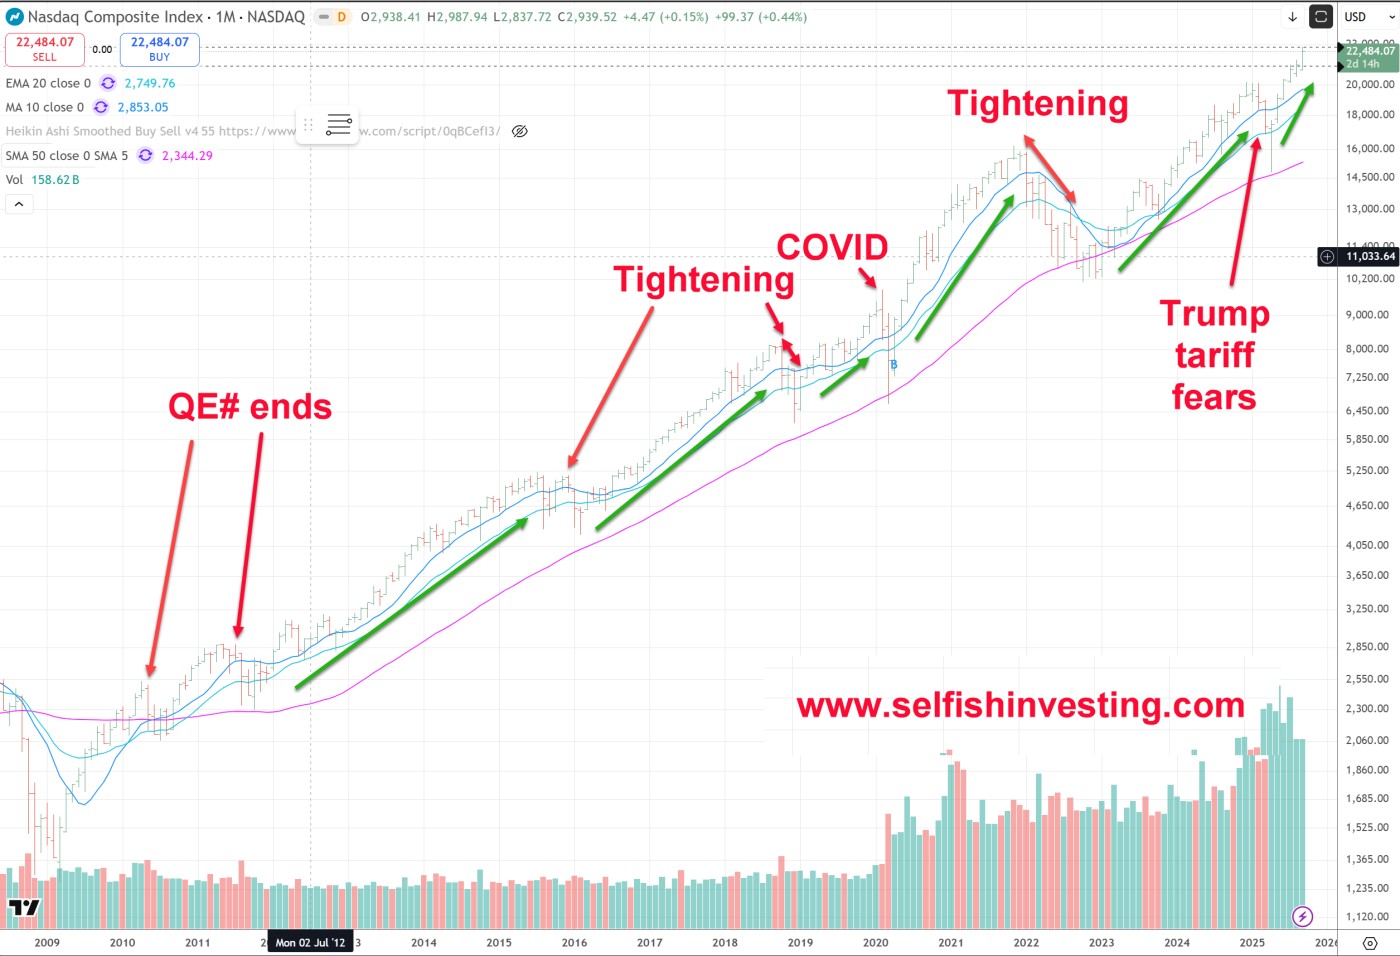
Before launching into the debate, we must acknowledge that major stocks and bitcoin correlate strongly with global liquidity. The reason the dot-com bubble burst in the year 2000 was because the Fed slowed easy money since fears of the Y2K debacle turned out to be a tiny trickle, a non-event. With tighter money and grossly overvalued dot-coms with little to no revenues and defective business models, the bubble burst. So the AI bubble is likely to continue to grow as long as global liquidity continues at its overall pace.As you can see, the NASDAQ Composite correlates strongly with QE:
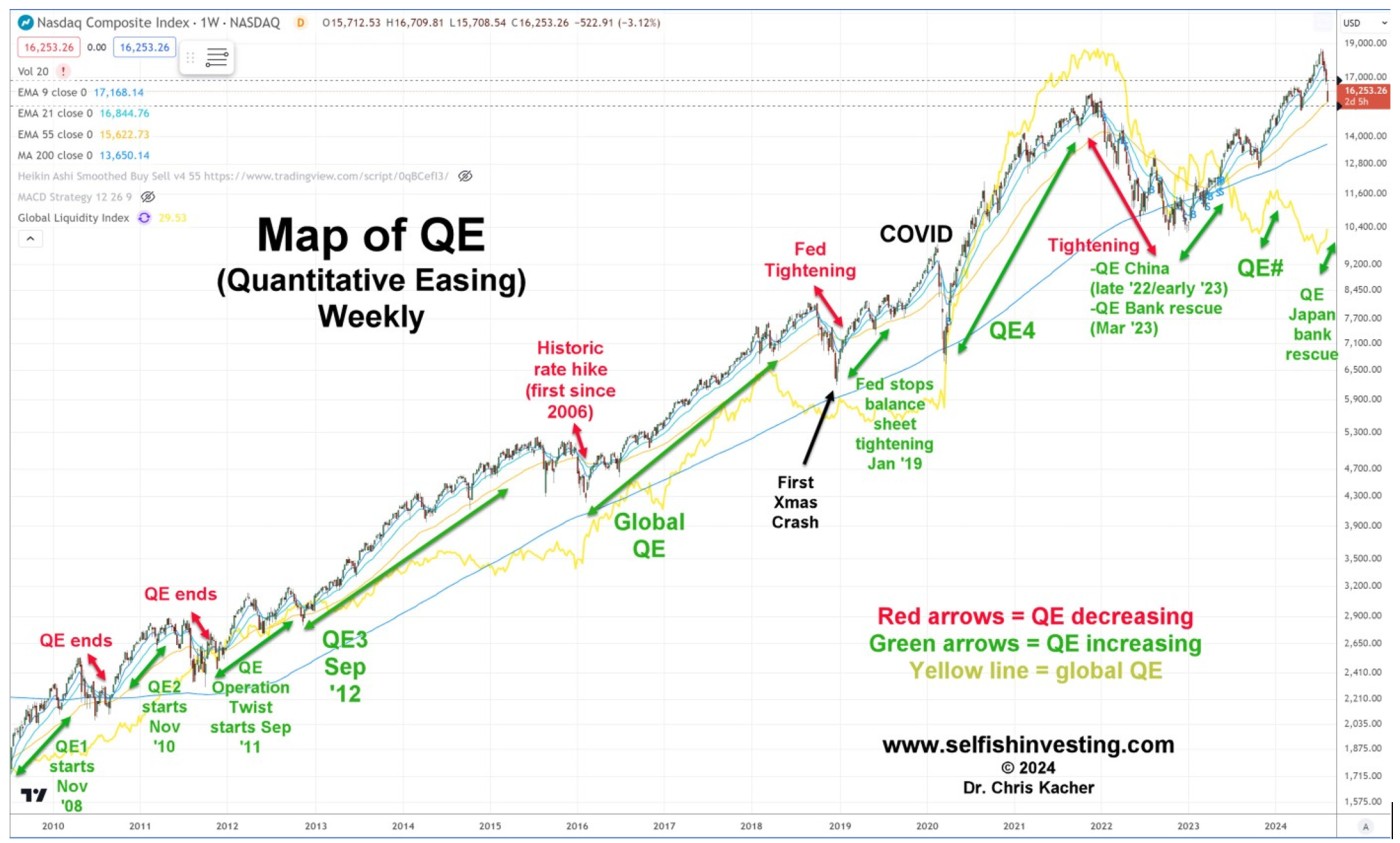
If we look at GDP growth, it can be framed as population growth + productivity growth + debt growth. Aging demographics shrink labor forces (fewer workers, retirees drag) forcing endless debt expansion to sustain economies. Governments monetize this via liquidity injections at an 8% annual debasement rate, inflating assets like Bitcoin (80- 90% correlated to global liquidity) while punishing cash holders.
This suggests that at least for 2026, AI-intensive sectors such as uranium and data center as well as bitcoin-related names will continue higher as global liquidity takes hold pushing major averages back to new highs.
AI Bullish case
AI clearly has speculative elements, but there is also hard evidence that (a) we may still be early in a genuine multi‑year build‑out, (b) capabilities and demand are compounding fast enough to absorb a lot of current capex, and (c) as long as global liquidity remains loose, the bull market can plausibly run another 1–2 years.
1. AI capabilities and usage are compounding brutally fast
Recent empirical work (METR and follow‑ups) shows that the length and complexity of tasks AI agents can handle has doubled roughly every 7 months from 2019–2025, a “new Moore’s law” far faster than historical hardware scaling.That is not just benchmark trivia:arxiv+3 In fact, some aspects of AI are doubling every 3 1/2 to 6 months.
- Google reports a roughly 14× increase in AI token usage in just eight months (Dec 2024–Aug 2025), implying very rapid real‑world adoption rather than purely speculative hype.dpaminvestments
- Enterprises are already paying for AI: multiple buy‑side analyses estimate that 15–25% of S&P 500 market cap reflects concrete expectations about AI‑driven earnings uplift, not fantasy 30‑year DCFs.ir-impact+1
If capabilities keep doubling every about 6–8 months, many of today’s “non‑economic” workloads (agents, automation, code, design, support) become economically attractive sooner than bears expect, pulling actual revenue and utilisation up into today’s overbuilt infra.
2. Demand is still outstripping capacity, not the other way around
Hard data from earnings calls contradicts the simple overcapacity story:
- Morgan Stanley and Bloomberg estimate AI and cloud capex will rise about 60% year on year in 2025 to around 490 billion dollars, with 2026 forecasts being revised upward as well because “customer demand for AI applications continues to exceed capacity” across US and Chinese hyperscalers and neo‑clouds like CoreWeave and Oracle.robeco
- In Q3 2025 big‑tech AI capex was up 75% year on year to 113.4 billion dollars, the fastest growth of the year. Amazon, Alphabet, and Meta all raised 2025 and 2026 capex guidance citing stronger‑than‑expected AI demand from both internal and external customers.io-fund+1
- Exponential growth in AI and robotics are pushing the planet into another tipping point. Elon Musk understands this. That said, neither are yet making a big enough impact on the economy to reach a supply-driven deflationary state due to record amounts of liquidity being created by central banks. Though the recent CPI data showed strong disinflation (slowing inflation). But AI and robotics are catching up fast to where Elon Musk’s estimation is that the US economy will hit a supply-driven deflationary period in three years.
This is a crucial difference from late‑stage bubbles such as 1999 fiber: there, utilisation never caught up for years; here, providers are still reporting sold‑out GPU clusters and waiting lists. That does not mean overbuild cannot come later, but it strongly supports the case that the next 1–2 years are still capacity‑constrained and growth‑friendly.hbr+1
3. QE and global liquidity still favour risk assets
Empirical work on global excess liquidity finds a persistent relationship between central‑bank balance‑sheet growth and equity returns: after 2000 the major bull legs in global stocks coincided with Fed, ECB, and BoJ expansion, while tightening phases (2000–02, 2007–09, 2018, 2022) lined up with major drawdowns.e-tarjome+2
Today:
- Despite headline “QT,” major central banks are again injecting net liquidity via various channels (reserve‑management purchases, standing facilities, swap lines), and global excess liquidity indicators remain elevated.omfif+2
- Credit conditions are far from 2000‑style tightness; IMF and BIS work suggests high public debt is already constraining how aggressive tightening can be, pushing policy toward financial repression with low real rates and supportive liquidity rather than Volcker‑style hikes.imf+2
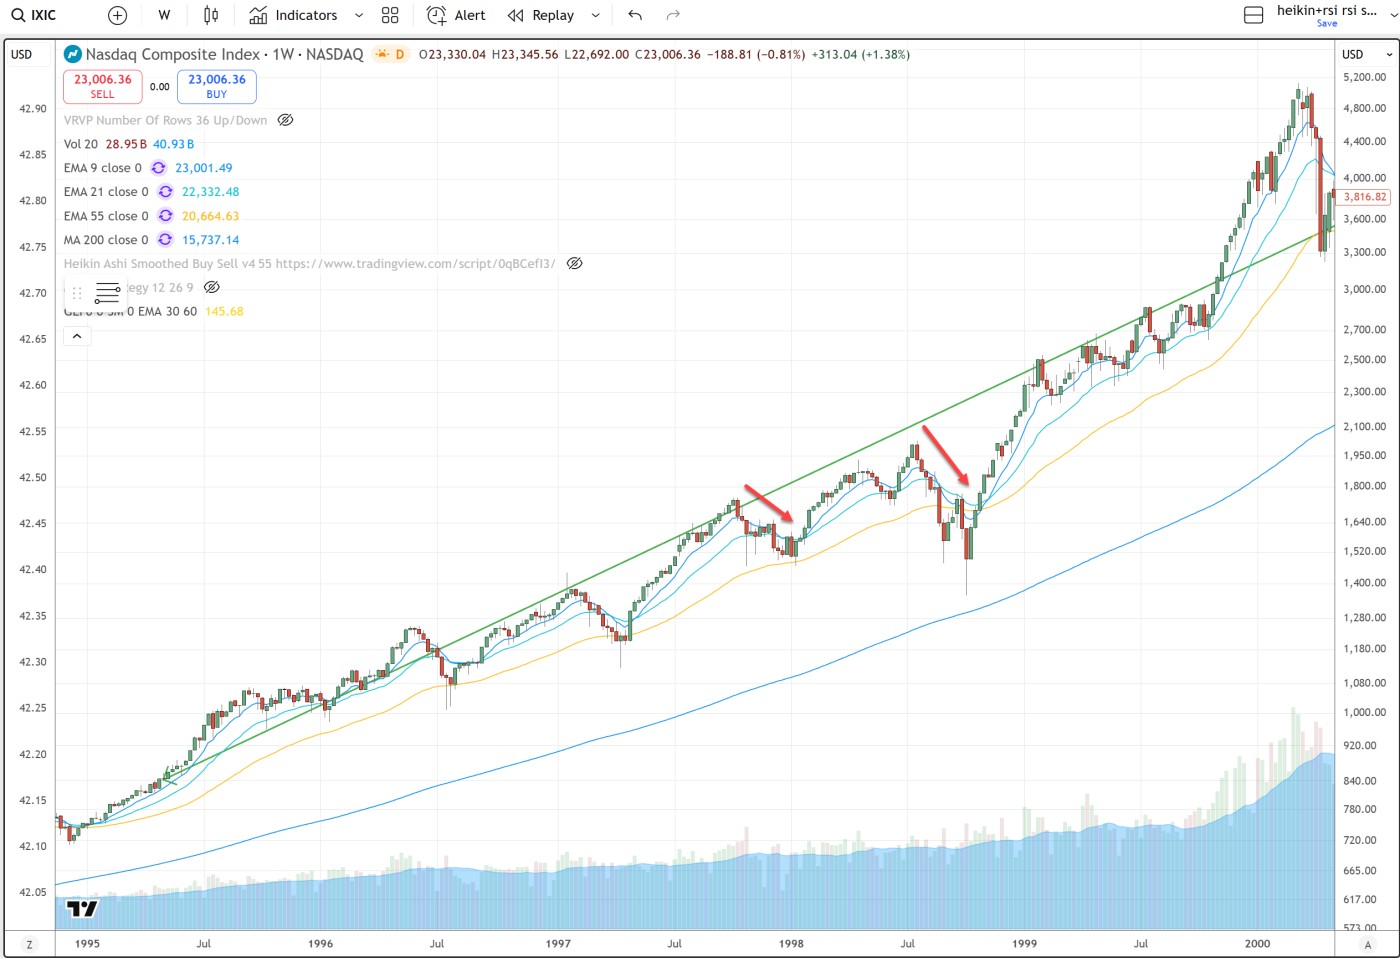
The dot‑com peak in March 2000 came after the Fed had clearly shifted to a tightening regime; we are not there yet. As long as global liquidity is expanding or at least not meaningfully contracting, history says the path of least resistance for richly‑priced growth and AI assets is still up or sideways, not immediate collapse. Also, let's not forget during the dot-com boom, there were substantial corrections along the way with mainstream media screaming that the bubble has burst such as in 1998. Many top traders were heavily short the market in October of that year.
4. Current valuations are elevated but not 1999‑style insanity
Even sceptical analyses concede that Nvidia, Microsoft, Alphabet, Amazon, and Meta remain highly profitable with strong free cash flow, unlike many dot‑com names that never earned a dollar. Concrete points:cazenovecapital+2
- Nvidia trades around 40–45× trailing earnings and low‑20s forward P/E, versus Cisco’s roughly 200–470× trailing and 130× forward P/E at the 2000 peak; revenue and EPS growth remain triple‑digit.hbr+1
- Several institutional pieces (“Ten reasons we are not in an AI bubble”, “Are we in an AI bubble or just at the beginning of a productivity boom?”) argue that on a PEG or cash‑flow basis, today’s leaders are expensive but broadly consistent with their growth profile, especially if AI drives even modest productivity acceleration.schroders+3
Put differently: some froth clearly exists at the edges (small caps, pre‑revenue AI), but the core of the AI trade is anchored in very real cash flows and is not priced like Pets.com.
5. Overspending can actually accelerate monetisation
History shows that “wasteful” overbuilding often seeds future profit pools faster than cautious investment would have:
- The 1990s fiber overbuild left dark fiber that later underpinned cheap broadband and cloud; early investors lost money, but the infra enabled a decade of profitable internet businesses.boxcars+1
- AI infra is even more flexible: unused GPU capacity can be repurposed quickly for new workloads, and hyperscalers can pivot capacity between their own products and external customers.deloitte+1
The current AI arms race, with big tech committing more than 1.1 trillion dollars in capex for 2025–27, forces them to find or create monetisation by integrating AI across search, ads, productivity suites, cloud, and consumer apps. That pressure is more likely to pull forward profitable use cases than to leave data centers permanently idle.robeco+2
6. Strategic incentives keep the race going
Finally, this is not a normal consumer‑internet fad; it is seen by states and firms as strategic infrastructure:
- Governments in the US, EU, and China explicitly frame AI as core to national security and industrial competitiveness, backing private capex with subsidies and favourable regulation.robeco+1
- For the top platforms, AI is existential: their core franchises in search, cloud, social, and e‑commerce are being re‑written. That is why they are willing to let AI capex approach 80–90% of operating cash flow for several years, because losing this race would permanently damage their moats.guinnessgi+2
This combination of state‑level and moat‑defence incentives makes it far more likely that heavy spending persists through at least 2026–27, supporting both earnings growth for suppliers and narrative support for the leaders.
Putting it together:
Yes, some metrics look bubbly, and overcapacity is a real tail risk in the later 2020s. But the hard data on capability doubling, usage growth, capex still chasing demand, global liquidity, and current profitability all support a credible thesis that we are still in the build‑out phase of a genuine technology S‑curve. Under that view, the AI bull market can rationally continue for another 1–2 years (or more), especially while central‑bank liquidity remains supportive and as accelerated innovation helps convert today’s “excess” infrastructure into tomorrow’s profit engine.
- https://arxiv.org/html/2503.14499v1
- https://metr.org/blog/2025-03-19-measuring-ai-ability-to-complete-long-tasks/
- https://www.smithstephen.com/p/the-new-moores-law-how-ai-agents
- https://www.linkedin.com/pulse/ai-capabilities-doubling-every-7-months-you-keeping-up-vijay-chintha-ma04e
- https://www.dpaminvestments.com/professional-intermediary/fr/en/angle/ten-reasons-we-are-not-in-an-ai-bubble
- https://www.ir-impact.com/2025/11/ai-bubble-or-a-soft-landing-looking-at-the-data-behind-technology-company-valuations/
- https://www.robeco.com/en-int/insights/2025/11/is-an-ai-bubble-forming-separating-hard-data-from-hype
- https://io-fund.com/ai-stocks/ai-platforms/big-techs-405b-bet
- https://www.guinnessgi.com/insights/are-we-in-an-ai-bubble
- https://hbr.org/2025/10/is-ai-a-boom-or-a-bubble
- https://e-tarjome.com/storage/btn_uploaded/2020-09-19/1600496070_11259-etarjome%20English.pdf
- https://www.quoniam.com/en/article/equities-valuation-inflation-fed/
- https://www.allianzgi.com/en/insights/outlook-and-commentary/equity-market-setbacks-are-normal
- https://www.omfif.org/2025/08/the-global-bond-glut-a-doom-loop-of-financial-repression/
- https://www.imf.org/en/publications/gfsr/issues/2025/10/14/global-financial-stability-report-october-2025
- https://www.capitaleconomics.com/publications/global-economics-focus/financial-repression-keep-lid-bond-yields
- https://www.imf.org/en/-/media/files/publications/wp/2023/english/wpiea2023143-print-pdf.pdf
- https://cepr.org/voxeu/columns/lessons-century-large-public-debt-reductions-and-build-ups
- https://www.bundesbank.de/en/publications/research/research-brief/2024-70-financial-repression-765512
- https://www.cazenovecapital.com/en-gb/uk/charity/insights/outlook-2026/are-we-in-an-ai-bubble-or-just-at-the-beginning-of-a-productivity-boom/
- https://www.mackenzieinvestments.com/en/institute/insights/monthly-economic-update-december-2025
- https://www.schroders.com/en-ch/ch/wealth-management/insights/outlook-2026/are-we-in-an-ai-bubble-or-just-at-the-beginning-of-a-productivity-boom/
- https://blog.boxcars.ai/p/making-it-up-in-volume-how-the-ai
- https://www.technostatecraft.com/p/dark-fiberan-archaeology-of-the-dot
- https://www.deloitte.com/us/en/insights/industry/power-and-utilities/data-center-infrastructure-artificial-intelligence.html
Bearish case
AI clearly has speculative elements, but there is also hard evidence that (a) we may still be early in a genuine multi year build out, (b) capabilities and demand are compounding fast enough to absorb a lot of current capex, and (c) as long as global liquidity remains loose, the bull market can plausibly run another 1–2 years. At the same time, some have raised serious concerns about overinvestment and concentration that investors should weigh alongside this more optimistic view.cazenovecapital+1
1. Why the bull case still has traction
Recent empirical work shows the length and complexity of tasks AI agents can handle has roughly doubled every 6–8 months since 2019, a “new Moore’s law” for capabilities. Usage is exploding: Google reports around a 14× jump in AI token usage in eight months, and buy side estimates suggest 15–25 percent of S&P 500 market cap already reflects concrete expectations for AI driven earnings, not just story stocks. On the supply side, Morgan Stanley and others see 2025 AI and cloud capex up roughly 60 percent to about 490 billion dollars, with 2026 guidance still being revised upward, because hyperscalers report demand for AI capacity continues to exceed what they can supply. This looks more like an early build out phase than a mature overcapacity bust.robeco+8
Global liquidity also still supports risk assets. Historical work on excess liquidity shows strong correlations between central bank balance sheet expansion and equity bull markets, while tightening phases match major drawdowns such as 2000–02 and 2007–09. Today major central banks are again adding net liquidity through reserve management purchases, facilities, and swap lines, while high public debts limit how aggressively they can tighten without triggering crises, keeping real rates suppressed through financial repression. That is very different from March 2000, when the Fed had already pivoted clearly into a tightening regime after the Y2K fears proved inconsequential.e-tarjome+6
Fundamentally, the core AI leaders are profitable. Nvidia trades around 40–45× trailing earnings and low 20s forward, far below Cisco’s 200–470× at the peak, while Microsoft, Alphabet, Amazon, and Meta generate large free cash flows that can fund AI capex internally. Several institutional analyses argue that on PEG or cash flow measures, valuations are elevated but not completely detached from growth, especially if AI raises productivity even modestly. Historically, “wasteful” infra booms have seeded later profit pools: dark fiber from the 1990s later enabled broadband and cloud, and AI infra is even more flexible, since unused GPU capacity can quickly be redeployed to new workloads. With governments treating AI as strategic and hyperscalers seeing it as existential to their moats, they are strongly incentivised to turn capex into revenue faster, which can pull monetisation forward rather than leave racks idle.cazenovecapital+10
2. The strongest arguments that this can still end badly
Some rightly point out that past technology booms often looked most convincing right before they cracked. Analysts note that market concentration is at 145 year highs, with the top 10 S&P 500 names around 40 percent of index weight and a single company near 16 percent of US GDP, far beyond anything seen in previous cycles. Analysts document that big tech is committing roughly 400 billion dollars a year to AI infrastructure while utilisation of existing servers is only about 12–18 percent and up to 10 million servers sit idle, echoing the 1990s telecom bubble where 500 billion dollars of fiber capex left 85–95 percent of capacity dark and ultimately destroyed around 7 trillion dollars of equity. On current projections, OpenAI alone could lose around 143 billion dollars cumulatively before becoming profitable, and leading model companies as a group are on track for well over 150 billion dollars in losses over the next few years, dwarfing pre profitability losses at Amazon, Tesla, or Uber.
Analysts also highlight that recent US GDP growth is unusually narrow: without data center related investment, first half 2025 real growth would have been roughly 0.1 percent, suggesting the broader economy is stagnating while AI capex does the heavy lifting. That concentration makes the cycle fragile: if AI spending slows or projects disappoint, both GDP and markets could feel a sharp air pocket. It marshals evidence that many AI projects are already failing at high rates, with reports that up to 40 percent of firms are abandoning most AI initiatives and failure rates in enterprise projects approaching 80 percent. That questions how quickly all this infra can be turned into profitable, sticky revenue.
Finally, analysts stress the structural parallels with prior bubbles. They note that the railway mania, 1990s telecom, and dot com episodes all went from narrative dominance and frantic capex to 50–80 percent drawdowns once overcapacity and weak returns became undeniable, typically on a 3–7 year timeline. They warn that today we already see early signs of this dynamic: GPU rental prices have fallen more than 20 percent year on year, suggesting supply is beginning to catch up, and that AI capex to revenue ratios for some leaders are running at 16 to 1, implying a very long path to payback. Even if liquidity and profitability keep the party going for another couple of years, history says investors can still face a lost decade of sideways returns once expectations normalise.
In other words, there is a coherent bull case for AI and for the bull market to continue while liquidity is abundant and capabilities are compounding, but analysts are right to warn that extreme concentration, low utilisation, massive projected losses, and the narrowness of macro growth mean this regime is fragile. Both sides can be true at once: the next 1–2 years can remain strong, yet the longer the race continues at current intensity, the more violently expectations may eventually have to correct if AI earnings do not catch up with the trillion dollars already wagered on its promise.
- https://ppl-ai-file-upload.s3.amazonaws.com/web/direct-files/attachments/124825203/49b73055-5607-4197-b5be-791e38de8087/251215-V1-Pursuing-the-Artificial-Tulips.docx
- https://www.cazenovecapital.com/en-gb/uk/charity/insights/outlook-2026/are-we-in-an-ai-bubble-or-just-at-the-beginning-of-a-productivity-boom/
- https://www.robeco.com/en-int/insights/2025/11/is-an-ai-bubble-forming-separating-hard-data-from-hype
- https://arxiv.org/html/2503.14499v1
- https://metr.org/blog/2025-03-19-measuring-ai-ability-to-complete-long-tasks/
- https://www.smithstephen.com/p/the-new-moores-law-how-ai-agents
- https://www.linkedin.com/pulse/ai-capabilities-doubling-every-7-months-you-keeping-up-vijay-chintha-ma04e
- https://www.dpaminvestments.com/professional-intermediary/fr/en/angle/ten-reasons-we-are-not-in-an-ai-bubble
- https://www.ir-impact.com/2025/11/ai-bubble-or-a-soft-landing-looking-at-the-data-behind-technology-company-valuations/
- https://io-fund.com/ai-stocks/ai-platforms/big-techs-405b-bet
- https://www.guinnessgi.com/insights/are-we-in-an-ai-bubble
- https://e-tarjome.com/storage/btn_uploaded/2020-09-19/1600496070_11259-etarjome%20English.pdf
- https://www.quoniam.com/en/article/equities-valuation-inflation-fed/
- https://www.allianzgi.com/en/insights/outlook-and-commentary/equity-market-setbacks-are-normal
- https://www.omfif.org/2025/08/the-global-bond-glut-a-doom-loop-of-financial-repression/
- https://www.imf.org/en/publications/gfsr/issues/2025/10/14/global-financial-stability-report-october-2025
- https://www.imf.org/en/-/media/files/publications/wp/2023/english/wpiea2023143-print-pdf.pdf
- https://www.bundesbank.de/en/publications/research/research-brief/2024-70-financial-repression-765512
- https://www.mackenzieinvestments.com/en/institute/insights/monthly-economic-update-december-2025
- https://hbr.org/2025/10/is-ai-a-boom-or-a-bubble
- https://www.schroders.com/en-ch/ch/wealth-management/insights/outlook-2026/are-we-in-an-ai-bubble-or-just-at-the-beginning-of-a-productivity-boom/
- https://blog.boxcars.ai/p/making-it-up-in-volume-how-the-ai
- https://www.deloitte.com/us/en/insights/industry/power-and-utilities/data-center-infrastructure-artificial-intelligence.html
- https://www.technostatecraft.com/p/dark-fiberan-archaeology-of-the-dot
As for the tariffs and AI boom sugarcoating it:
Tariffs as a drag under the surface
Studies of the 2025 Trump tariff package estimate meaningful hits to growth, trade and real incomes: US and global analyses see US real GDP 0.5–0.9 percentage points lower in 2025, higher inflation, and trade volumes shrinking as the effective tariff rate rises toward 16–18 percent, the highest since the 1930s. Forecasts now point to global trade growth slowing toward 0.5 percent in 2026 as tariff risks escalate, which is a classically bearish macro backdrop for risk assets.globaltrademag+6
AI boom sugarcoating and crowding out
Several pieces argue that AI capex is effectively masking this weakness and diverting capital: AI related investment has been the largest single contributor to US GDP growth, with AI capex exceeding 1.1 percent of GDP and overtaking consumer spending as the main growth driver in early 2025, while the rest of the economy looks soft. Analysts and risk groups warn that hyperscalers’ roughly 400–600 billion dollars of yearly AI spend risks crowding out other manufacturing and industrial investment and that the benefits are highly concentrated in a few mega caps rather than broad based.jpmorgan+4
Put together, here is a real bearish angle: tariffs are structurally weakening trade and real growth, while the AI boom both hides that damage in the macro data and channels scarce capital into a narrow, speculative complex instead of diversified, productivity enhancing investment. If AI returns disappoint or AI capex slows at the same time that tariff damage shows through, the unwind could be sharper than headline growth numbers currently imply.realinvestmentadvice+2
- https://www.globaltrademag.com/global-trade-to-slow-to-0-5-in-2026-as-tariff-risks-escalate-ing-warns/
- https://www.intereconomics.eu/contents/year/2025/number/4/article/the-trade-deficit-delusion-why-tariffs-will-not-make-america-great-again.html
- https://budgetlab.yale.edu/research/where-we-stand-fiscal-economic-and-distributional-effects-all-us-tariffs-enacted-2025-through-april
- https://www.nytimes.com/2025/11/19/us/politics/trumps-tariffs-trade-data.html
- https://www.brookings.edu/articles/tariffs-are-a-particularly-bad-way-to-raise-revenue/
- https://www.sciencedirect.com/science/article/pii/S0022199625000959
- https://www.equiti.com/sc-en/news/global-macro-analysis/global-economy-in-2026-rate-cuts-ai-investment-and-the-uneven-fallout-from-tariffs/
- https://am.jpmorgan.com/us/en/asset-management/adv/insights/market-insights/market-updates/on-the-minds-of-investors/is-ai-already-driving-us-growth/
- https://realinvestmentadvice.com/resources/blog/capex-spending-on-ai-is-masking-economic-weakness/
- https://www.garp.org/risk-intelligence/technology/ai-bubble-boom-251107
- https://www.traxtech.com/ai-in-supply-chain/ai-infrastructure-spending-sparks-economic-crowding-out-debate
- https://www.reuters.com/legal/transactional/great-ai-buildout-shows-no-sign-slowing-2025-10-31/
- https://themacrobutler.substack.com/p/ai-boom-or-bust-prosperity-through
- https://tax.thomsonreuters.com/blog/impact-of-tariffs-on-tax-and-trade-tri/
- https://www.jpmorgan.com/insights/global-research/current-events/us-tariffs
- https://www.stlouisfed.org/on-the-economy/2025/oct/how-tariffs-are-affecting-prices-2025
- https://www.cnn.com/2025/04/01/business/ai-bubble-markets-tariffs-nightcap
- https://www.aljazeera.com/economy/2025/10/14/imf-says-ai-investment-bubble-could-burst-comparable-to-dot-com-bubble
- https://www.dandodiary.com/2025/12/articles/trump-administration/big-ai-investments-have-muted-the-tariff-impact-but-will-it-continue/
- https://www.scmp.com/tech/article/3335654/ai-spending-helps-save-global-economy-under-threat-trade-war-imf-director-says
Bull Timeline (2025-2027+)
Now-2026: Early build-out—AI capabilities double 6-8mo (new Moore's Law); demand > supply (capex +60% to $490B '25, clusters sold out); profitable leaders (Nvidia 40x vs Cisco 200x); liquidity supportive (no 2000 tightening).
2026-27: Heavy spending ($1.1T capex) forces monetization; overbuild seeds profits (like 1990s fiber); strategic race sustains growth.
2028+: Potential supply deflation (Musk: 3yrs); productivity boom if utilization ramps.
Bear Timeline (Fragile 2025-2028+)
2025-26: Concentration peaks (top 10 S&P 40%); low utilization (12-18%, 10M idle servers); $150B+ losses; tariffs drag GDP 0.5-9pp, trade to 0.5%; AI masks weakness, crowds out investment.
2027-30: Overcapacity hits (GPU prices -20%, capex/revenue 16:1); 40-80% project failures; parallels dot-com/telecom (50-80% drawdowns 3-7yrs post-peak).
Post-2030: Lost decade if earnings disappoint; unwind sharpens with tariff damage.
Net: Bull to 2026-27 (liquidity + compounding), bear risk late 2020s (overbuild + macro).
In conclusion, the AI narrative pits a compelling bull case fueled by capabilities doubling every 6-8 months, explosive demand outstripping $490B+ capex through 2026-27, profitable leaders at reasonable multiples (Nvidia 40x vs. 1990s Cisco's 200x), and supportive global liquidity ($10T US debt maturities, $3-4T SLR unlocks) against bearish risks of extreme concentration (top 10 S&P at 40%), low utilization (12-18%, 10M idle servers), $150B+ losses, 40-80% project failures, and tariff drags (0.5-0.9pp GDP hit) masking underlying weakness. While liquidity and compounding sustain the bull into 2026-27, late-2020s overbuild and macro fragility could trigger a 50-80% drawdown akin to dot-com/telecom; the next 1-2 years look strong, but investors must watch utilization ramps (low current usage 12-18%, 10M idle servers) must convert to revenue (else $150B+ losses sink returns) as well as tariffs which erode GDP 0.5-0.9%.