Market Lab Report / Dr. K's Crypto-Corner
by Dr. Chris Kacher
The (R)Evolution Will Not Be Centralized™
On Monday, when it looked as if the market would stage a deeper correction, Powell came out with a $250 billion corporate bond buying program. Markets finished the day on a high volume upside reversal. The Trump administration is also discussing an additional $1 trillion infrastructure spending bill. Meanwhile, the Bank of Japan increased the size of its corporate lending program to the equivalent of $1 trillion. Then the European Central Bank carried out its largest ever injection of liquidity in a move to push interest rates even more negative. Banks borrowed the equivalent of $1.47 trillion from the ECB's latest operation, offering rates as low as -1%. Not to be excluded from the ongoing money printing party, the Bank of England increased its asset purchase program by another 100 billion pounds.
Major averages in the U.S. rose on higher volume on both Monday and Tuesday, with the NASDAQ Composite bouncing off its 20-dema and the S&P 500 off its 200-dma. This showed institutions were accumulating stock.
As discussed, Grayscale bitcoin ETN GBTC started the week by bouncing off its 10- and 40-week moving averages. Bitcoin itself has yet to clear the $10,000 level as this has been met with selling resistance each time.
On healthcare stocks that will benefit from the post-COVID environment, one is DXCM which monitors the glucose levels of diabetics. It had a pocket pivot on Monday. The closer one buys to areas of logical support, the lower the risk. Another stock is LVGO which provides digital health devices that monitor chronic health conditions. This was first mentioned on April 27, then again on June 10. Both dates were pocket pivots. On Wednesday, LVGO had a high volume reversal. Keep an eye out for constructive pullbacks as it is currently extended.
Over in cloud stocks, cloud-based platform provider TWLO had a pocket pivot on Tuesday so should be watched for a low risk entry point. Another cloud company, SHOP which is a cloud-based commerce platform for small and medium sized businesses, gapped higher on Monday. This too should be watched for a low risk entry point. Both will benefit from the post-COVID environment. The areas of online business and collaboration should continue to do well.
Two interesting ETFs hit my radar. One is BOTZ which focuses on companies in AI and robotics. We are undergoing a major megatrend in both areas so this ETF has more than recovered the prior peak made in March before the crash. There is also SOCL which is an ETF that invests in social media companies. It has achieved new highs as of late.
Bitcoin's Stock-to-Flow Model
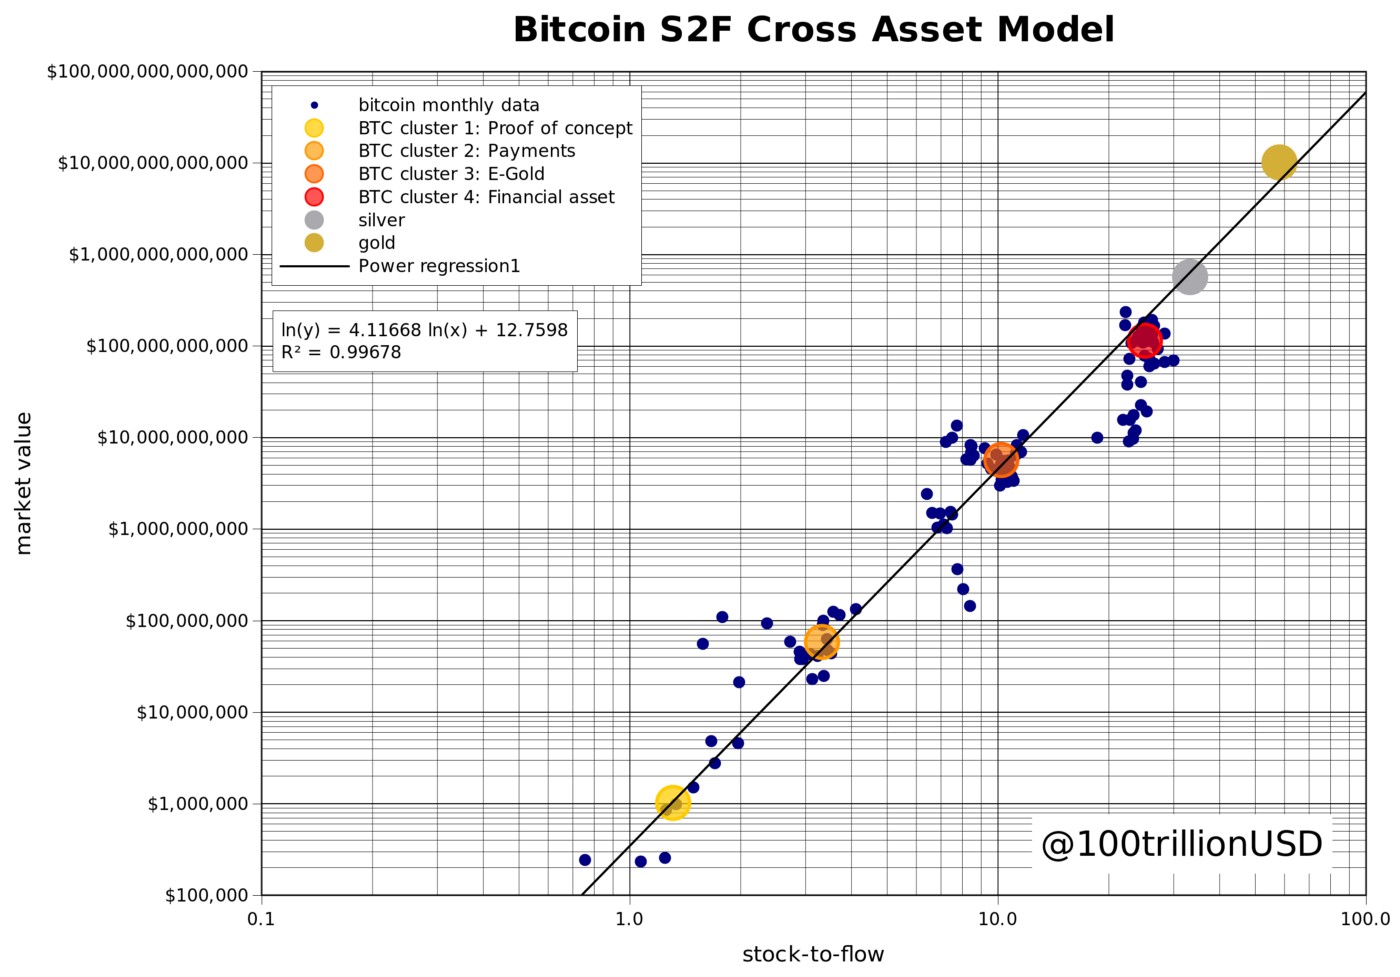
Now as concerns bitcoin, one interesting take on future bitcoin valuations is the stock-to-flow (S2F) model. Stock is the size of the existing stockpiles or reserves. Flow is the yearly production. This has relevance with commodities such as gold and silver as well as bitcoin. It illustrates that the value of bitcoin tends to grow by an order of magnitude (10-fold) when it expands into a new use case as shown in a plot showing valuation vs. stock-to-flow ratio. Based on projections, should the linearity of bitcoin price clusters as plotted on a log plot continue, bitcoin should reach a valuation of $288,000 sometime before 2024 as the plot (that I will send) illustrates. Note that bitcoin tends to overshoot into climax tops often by 2-3x making my original call of bitcoin at $1,000,000 by the end of 2023 a real possibility. I came to this number in 2017 on the basis of historical trends plotted since 2010, factoring in the 2-3x overshoot factor. In other words, after its bubble bursts yet again, its price will probably settle around 1/3 of its peak, or around $300k, with knee-jerk major lows around $100-150k if history is any guide.
Each of the four identified BTC clusters shown in the plot has a very different S2F-market value combination that seems to be consistent with halvings and changing BTC narratives.
- BTC “Proof of concept” (S2F 1.3 and market value $1M)
- BTC “Payments” (S2F 3.3 and market value $58M)
- BTC “E-Gold” (S2F 10.2 and market value $5.6B)
- BTC “Financial asset” (S2F 25.1 and market value $114B)
Bitcoin is the first scarce digital object the world has ever seen that stores and transacts value, unhampered by borders. It is scarce like silver & gold, and can be sent over the internet, radio, satellite, mesh etc. As cryptokitties and digital multiplayer online gaming have illustrated, digital scarcity has value. The next cluster of value up the exponential growth curve will be spurred by accelerated institutional onboarding, global usage continuing to double every year, and the $30+ trillion in wealth to be inherited by millenials who feel more comfortable owning bitcoin than gold. Bitcoin's numerous metrics as I have illustrated in various prior reports also continue to show routine strength.
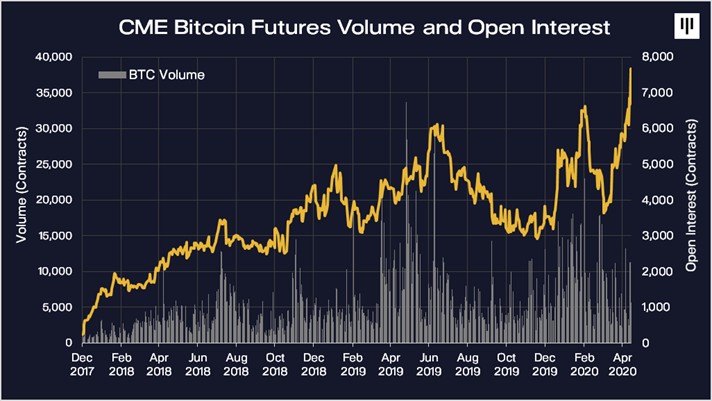
CME bitcoin futures volume continues to climb. Paul Tudor Jones, major exchanges including Kraken, and global macro hedge funds are all buying bitcoin to get at least some exposure to its uncorrelated asymmetry.Out of gold, bitcoin, and real estate, which is most likely to move higher by 10-fold over the next few years? Gold has a total value of roughly $8 trillion. Residential real estate is roughly around $160 trillion. Will their valuations rocket 10fold, gold to $80 trillion, real estate to $1600 trillion, sometime in the 2020s? What about bitcoin whose value is currently around $10,000 given its prior price history. The answer seems obvious.