
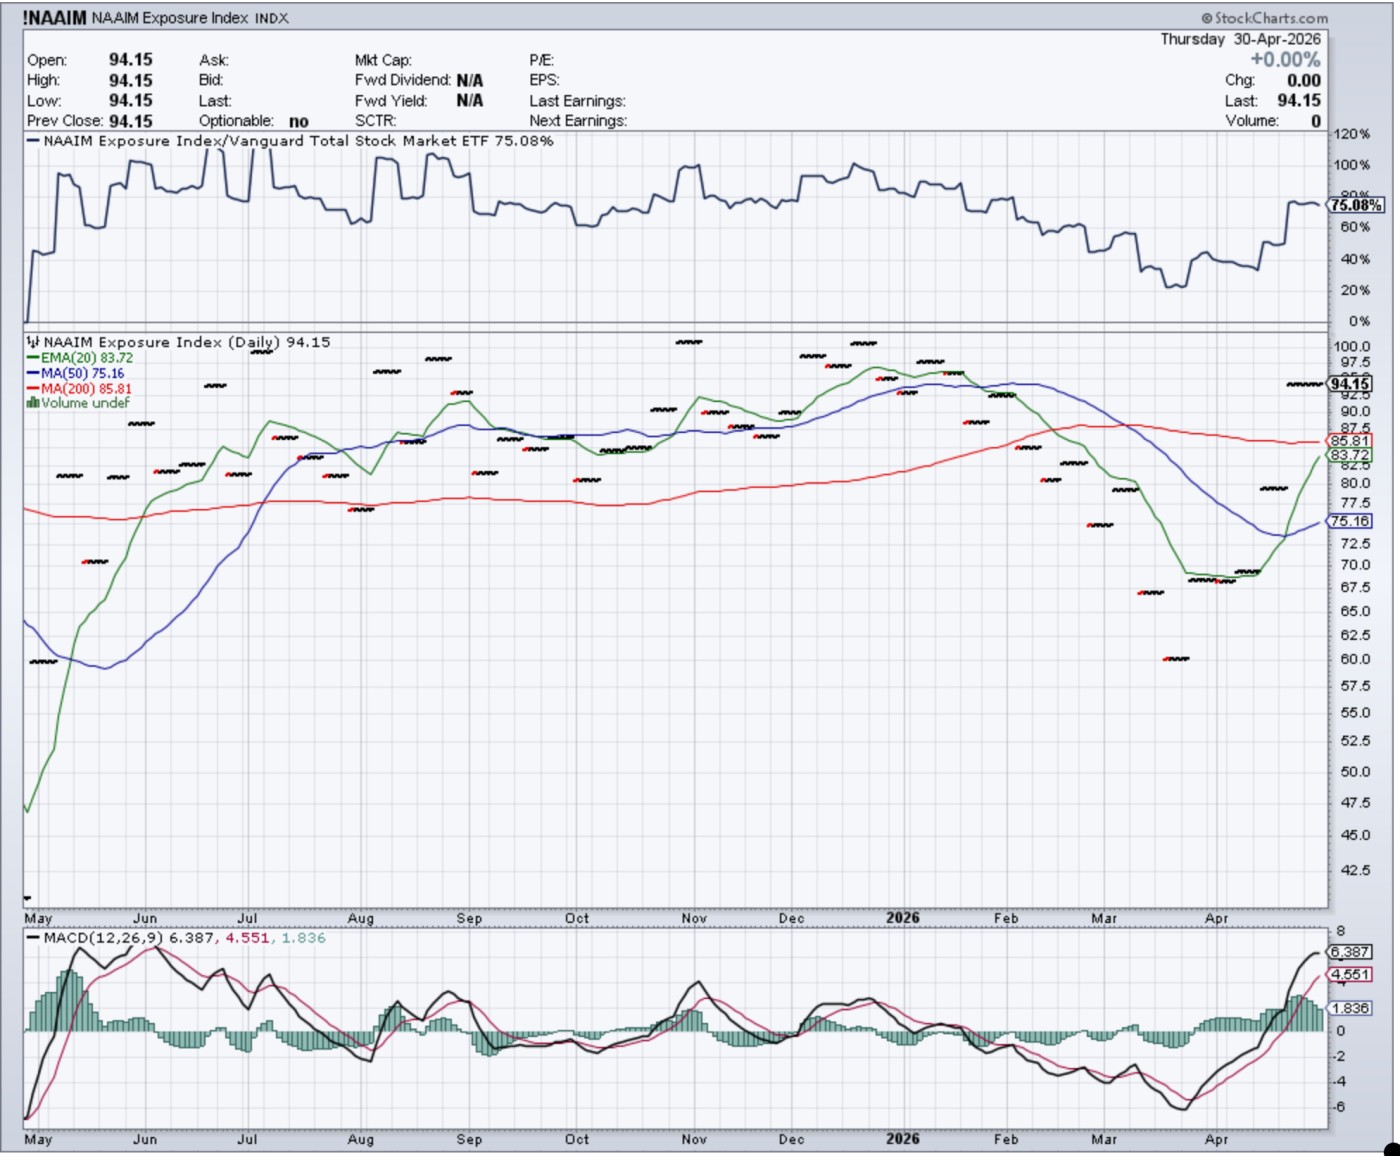
The NAAIM Exposure Index (active manager equity allocation) is currently at **94.15%** — an extremely high reading that sits near the upper end of its historical range.
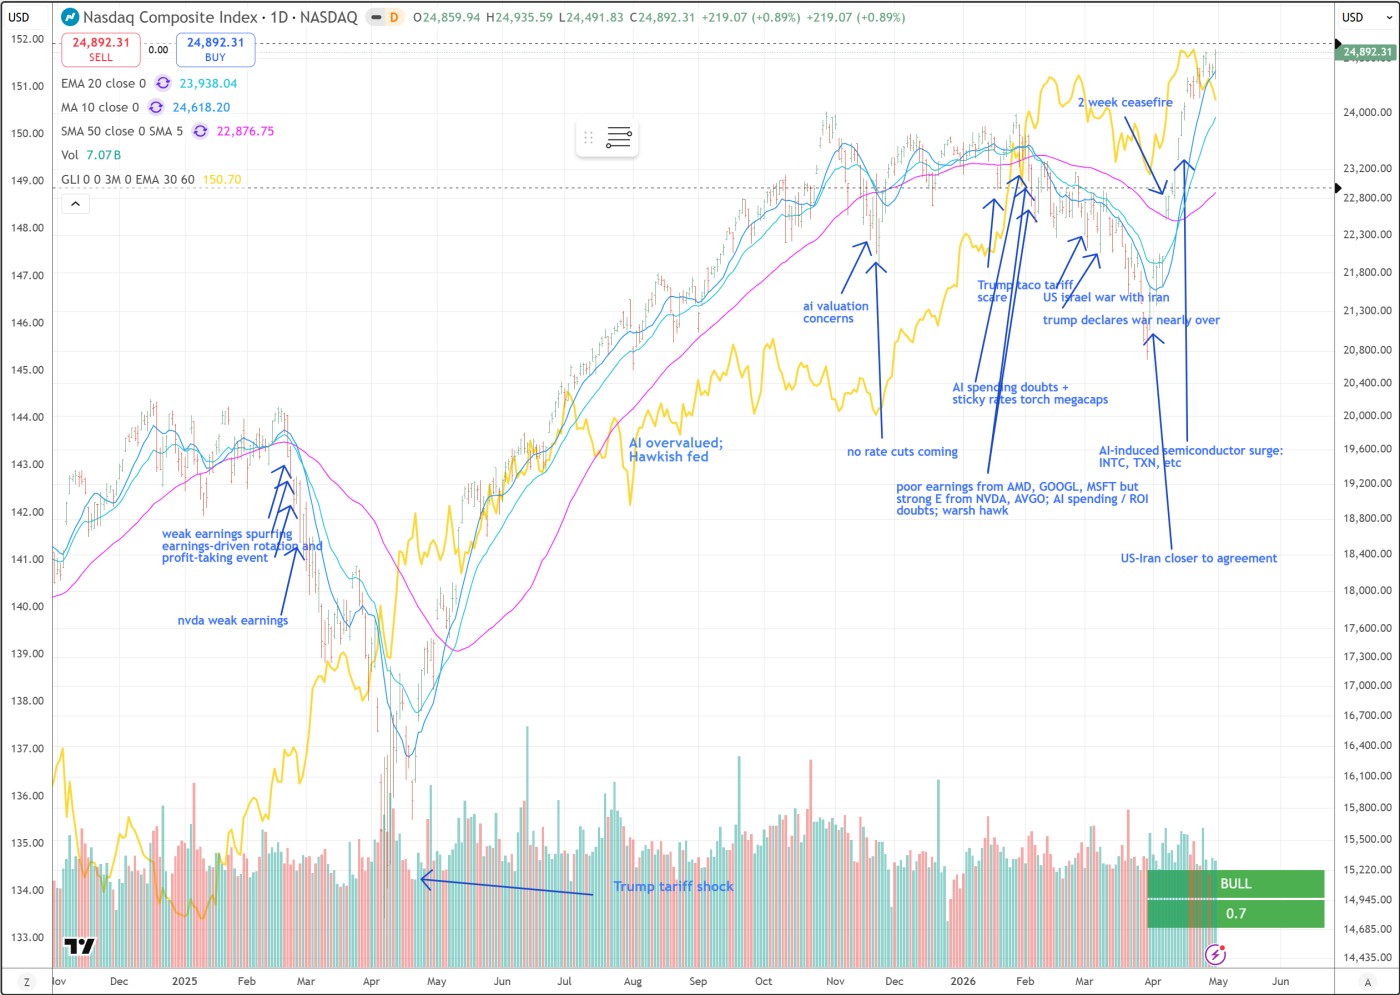
When overlaid with the Nasdaq Composite, the picture is clear:
- **Strong positive correlation in the recent rally**: As NAAIM exposure climbed sharply from the March 2026 lows (around 30–40%) toward 94%, the Nasdaq Composite was making fresh all-time highs in April. The two lines tracked upward together, showing that rising manager bullishness directly supported the Nasdaq’s move.
- **Current setup**: The Nasdaq is trading near record levels while NAAIM is at one of its highest readings in the past year. This reflects heavy long positioning by active managers and very little “dry powder” left for further buying.
**Key takeaway**
High NAAIM readings like 94% are often **contrarian signals**. They mark periods when sentiment is extremely bullish and the market can become vulnerable to pullbacks or corrections (as we saw with the modest reversal today after the mixed hyperscaler earnings). Historically, when NAAIM has been above 80–90%, the Nasdaq has sometimes paused or corrected shortly afterward, even if the long-term uptrend remains intact.
In short: the chart shows the Nasdaq rally was fueled by aggressive manager exposure, but we are now at levels where that exposure is stretched. This aligns with the capex fatigue and profit-taking we discussed after the April 29 earnings.
**AAII Sentiment Survey (American Association of Individual Investors)** measures the % of individual investors who are **bullish** on the stock market for the next 6 months.
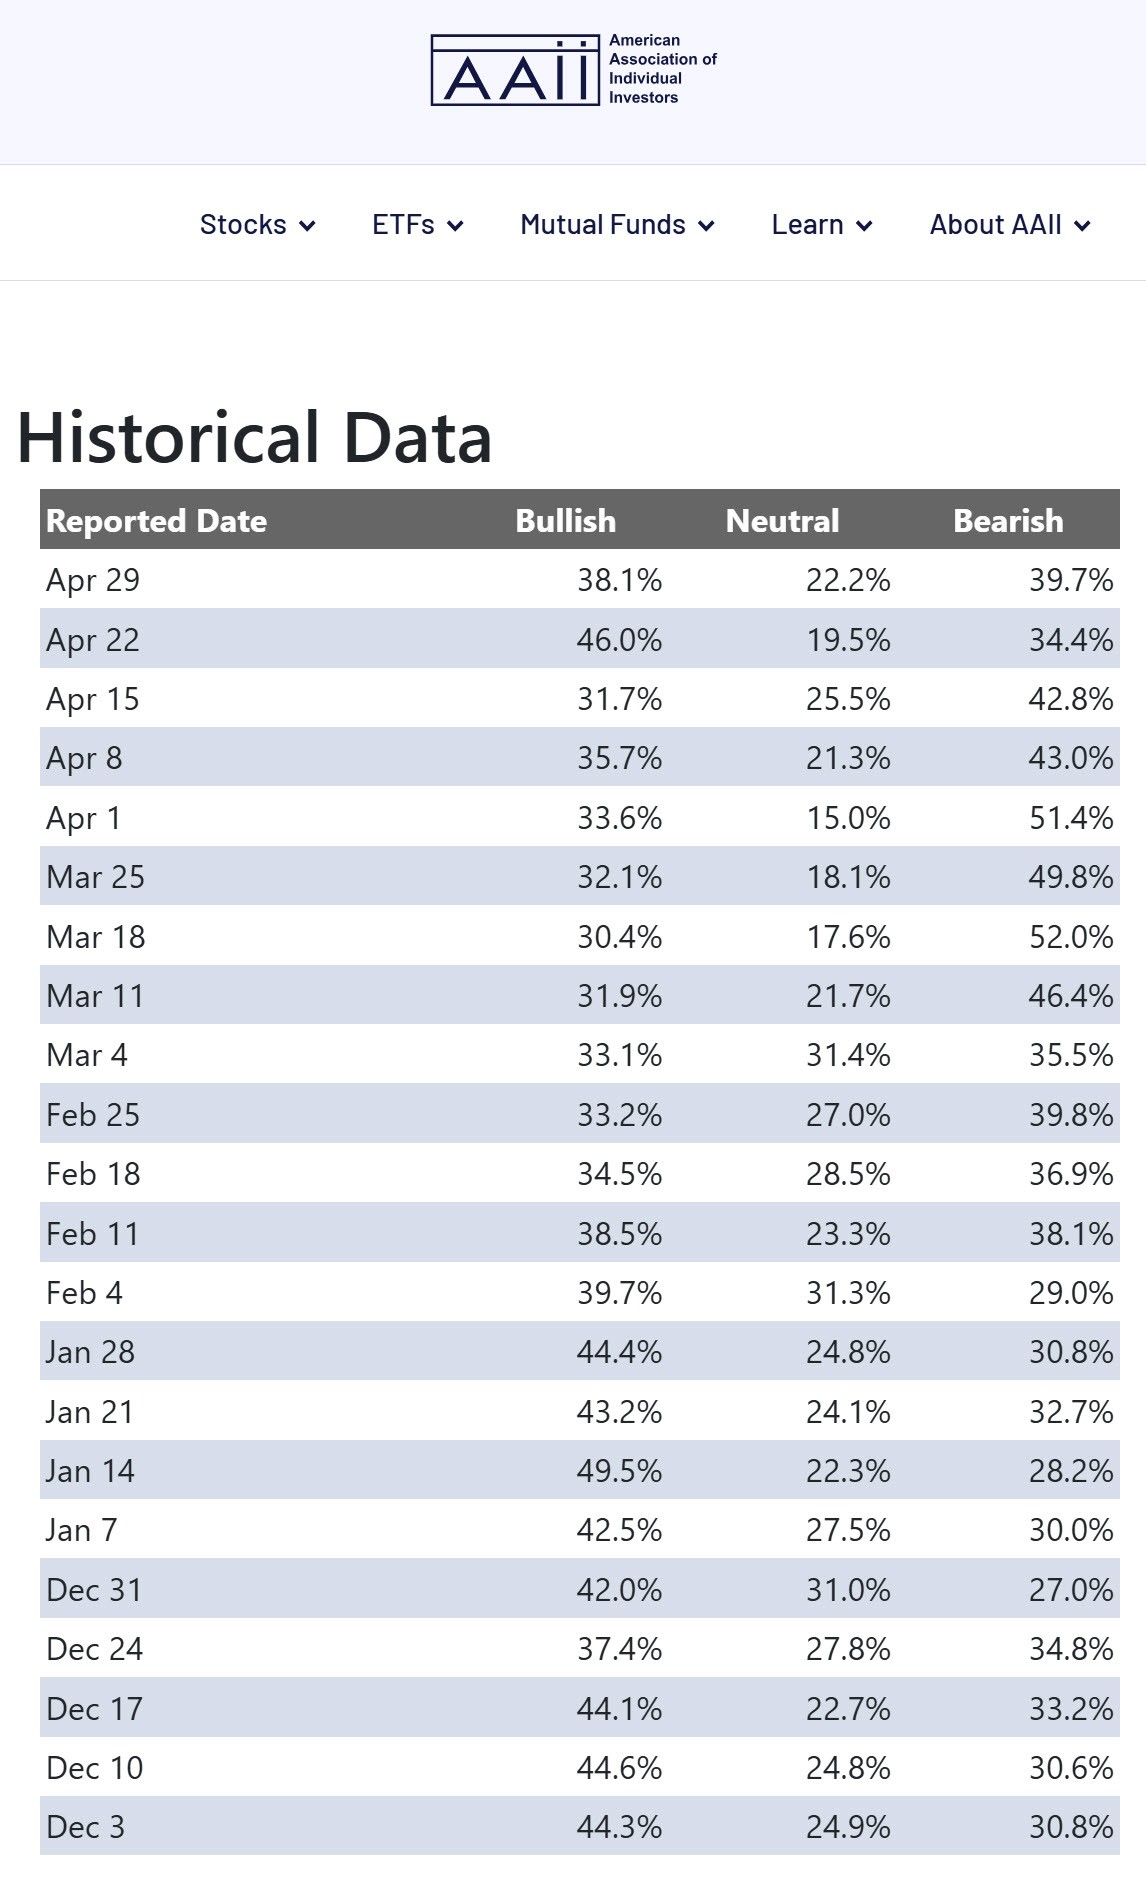
- Long-term average: ~37.5–38% bulls.
- **When AAII bulls rise above 40%**, it has historically been associated with **weaker forward returns** and a higher probability of market pullbacks or corrections in the Nasdaq Composite and S&P 500.
### Quick verification from the data:
- Extremely high bullish readings (especially **>45% or in the top historical percentiles**) have preceded below-average or negative returns over the following 4–12 weeks and even 6–12 months in many studies (including AAII’s own historical analysis).
- The April 22, 2026 reading hit **46.0% bulls** (well above 40%). This coincided with the Nasdaq reaching new highs, followed by the modest reversal/pullback we’ve seen in late April after the mixed hyperscaler earnings.
- Latest reading (week ending April 29) has already dropped to **38.1% bulls**, moving back closer to the long-term average.
This is why AAII is widely viewed as a **contrarian signal**: when retail investors become too optimistic (bulls >40%), the pool of new buyers shrinks and the market often pauses or corrects.
**Important nuance**:
It’s not a perfect or immediate trigger every single time — markets can stay elevated for a while even with high sentiment. But statistically, periods with AAII bulls comfortably above 40% have underperformed periods with lower bullish readings.
Also, the strongest stocks can buck any temporary pull back.
The NAAIM Exposure Index chart above (currently at 94.15%) shows a similar picture: professional managers are also very heavily allocated to equities, reinforcing the stretched sentiment environment.