
Market Lab Report / Dr. K's Crypto-Corner
by Dr. Chris Kacher
The (R)Evolution Will Not Be Centralized™

(click on image for hires version)
<<<Go to the last section "Where to next?" if you wish to skip over the history which I published back in Mar-2020>>>
Human Innovation Always Trumps Fear
It just goes to show that human intelligence, creativity, and innovation has outdone fear in every case so far. In every crisis, certain industry groups get hammered in hugely oversold fashion so become deep bargains. All crises resolve to the upside. That said, while markets have always recovered, it can take many years to breakeven if you bought at a peak. This is yet another reason why buy-and-hold is NOT a safe bet.
Instead, it pays to find those stocks that are likely to outperform due to their cutting edge technologies or innovative services. Use technicals to time one's entries and exits. I have a saying. When it comes to finding the next stock with huge upside price potential, buy only if both fundamentals AND technicals show this potential upside. Sell only on technicals. Price will show whether you are right or wrong so always heed your sell stops! You can always reenter the position.
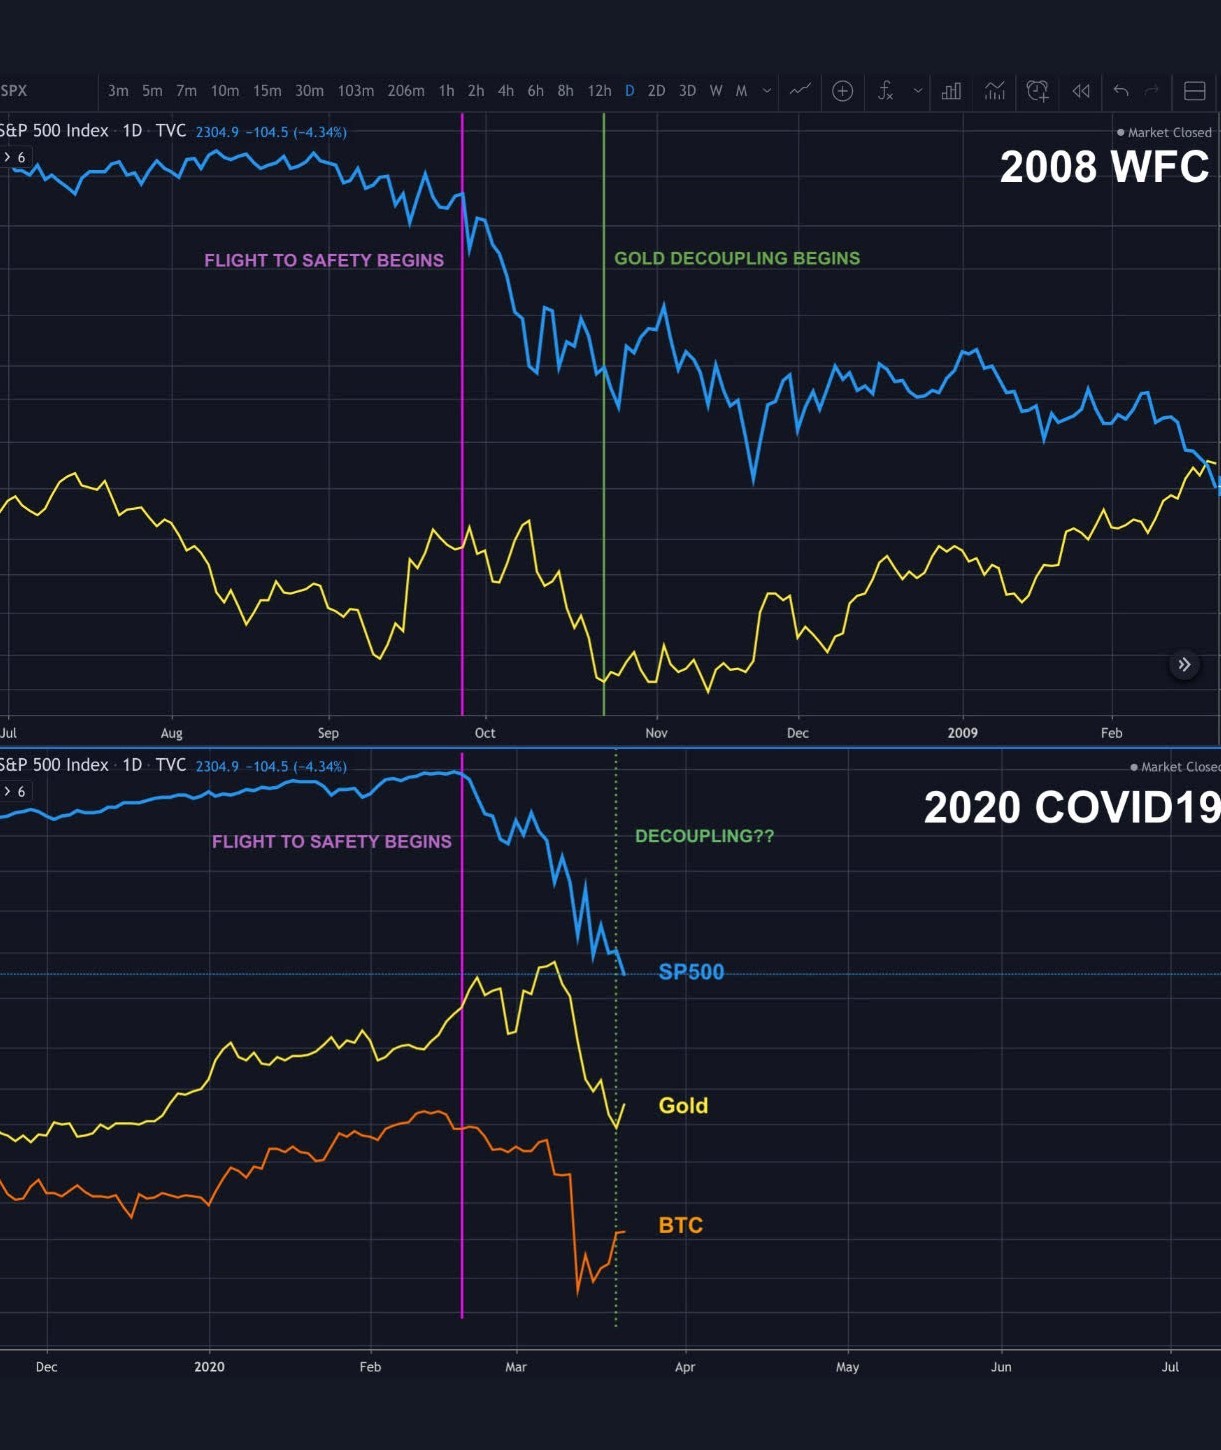
Where to FocusThe top 20% of stocks and ETFs leave many clues as to the potential future leaders. Stocks that resist downtrends in markets are a sign of great strength. When the weight of the market comes off, these stocks often act like coiled springs and shoot higher. Eventually, both gold and bitcoin may be such candidates. The blue line in the image below is the S&P 500 while the gold line is gold. You can see how back in 2008, everything including gold was sold off hard. But by November 2008, gold started to trade sideways compared to the S&P 500 which was still in an overall downtrend. Recent signs as I pointed out in the last webinar [in Mar 2020] show bitcoin has been the first to bounce. The Fed stepping in with fresh and monumental amounts of QE created a major low in cryptocurrencies.
Another focus point are the stocks performing in the bottom 20%. Such poor performers enables one to pinpoint which industry groups and stocks have been greatly oversold that may offer a huge upside. That said, with any major shift, some industry groups may not come back or stagnate so buyer beware. It takes much research and contextual analysis to separate the wheat from the chaff.
No One Knows The Future
When the legendary William O'Neil was ever asked in interviews where the market would be in the future, his response was always the same. "How should I know?" The point is that each day brings new information. The wise trader and investor assimilates the data then acts accordingly. It is a real-time approach. Predictions are subject to great error. Those who stake their reputations on predictions often find themselves psychologically wedded to such predictions. Therefore should one make a prediction, one should always be ready to change their view on a dime. Price dictates such actions. If your stop is hit, you might be wrong. Move onto the next opportunity or circle back if a second or multiple entry points arise while the risk/reward remains favorable. The trade of a lifetime often comes every few weeks, especially near market lows. Stay nimble and open to all possibilities.
Change is the Only Constant
The only constant when it comes to markets is change. Quantitative easing, or QE, was one of a number of material changes introduced to the markets which destroyed a number of variables that had once carried predictive value. Thus being able to pivot in a timely manner has always been critical to the few successful investors who have remained successful.
If we analyze a century worth of data, we will see that all crises were followed by major averages bottoming then moving higher which brought major buying opportunities.Some examples:
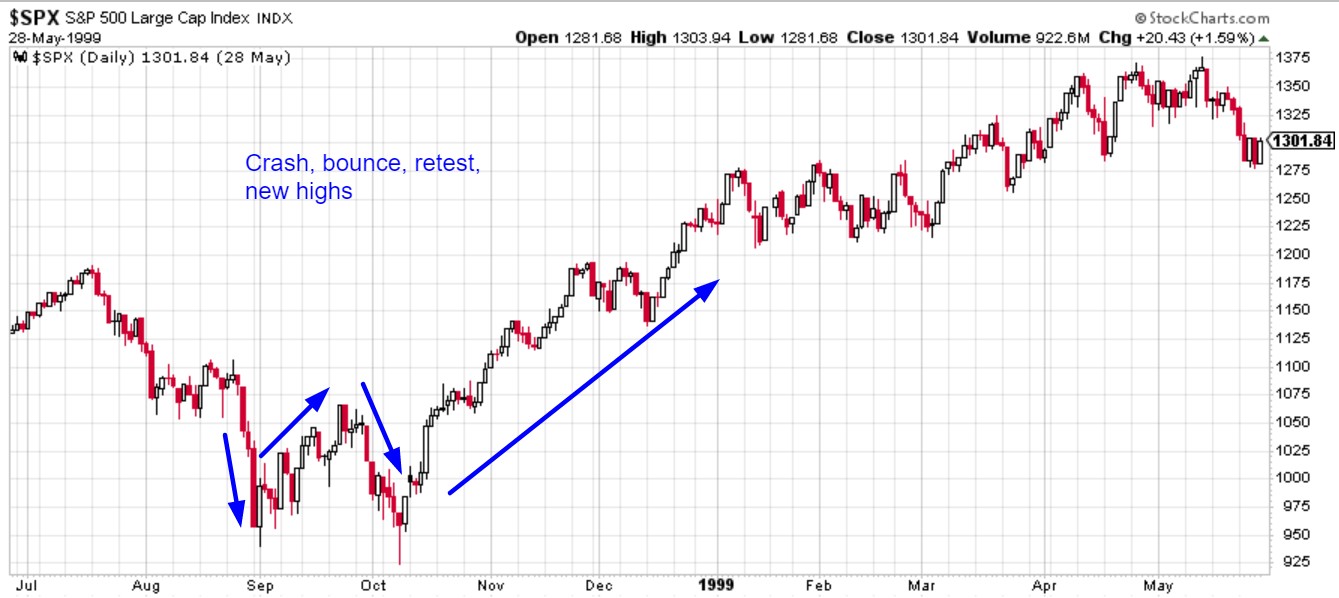
2008-2009 - Crash, bounce, retest, new highs
In 2008, markets were rescued by QE thus 2009 was the start of the decade+ bull and one of the best years for stocks. Gold was the first to reach new highs in a matter of months. It had lost about 1/3 of its value but this was a sign of strength relative to most all other industry groups which had lost roughly half or more of their values. Car rental companies came roaring back as their breakup value, ie, the value of their automotive fleets alone, far exceeded their stock price lows. Other groups followed. But try to pinpoint the bottom is a fool's game. It is best to monitor a range of industry groups, both leading and lagging, to get a sense of when markets make a major bottom. In the case of the NASDAQ-100, it bottomed in Nov-2008 then retested lows in Mar-2009. It was then off to the races. The S&P 500 undercut prior lows, then zoomed higher. A number of stocks in the top and bottom 20% zoomed higher. Pocket pivots and buyable gap ups were numerous as well as undercut & rally formations enabling one to get quick exposure to the nascent bull market.
New bull market due to: Quantitative easing (QE1) which kicked off this "Era of QE".
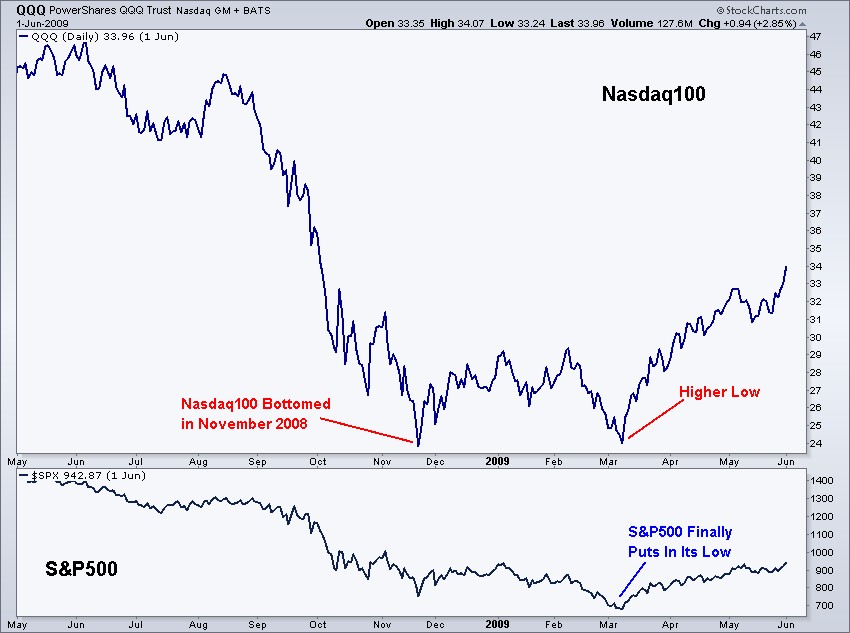
Courtesy of https://allstarcharts.com/u-s-stock-market-bottomed-2008-march-2009/
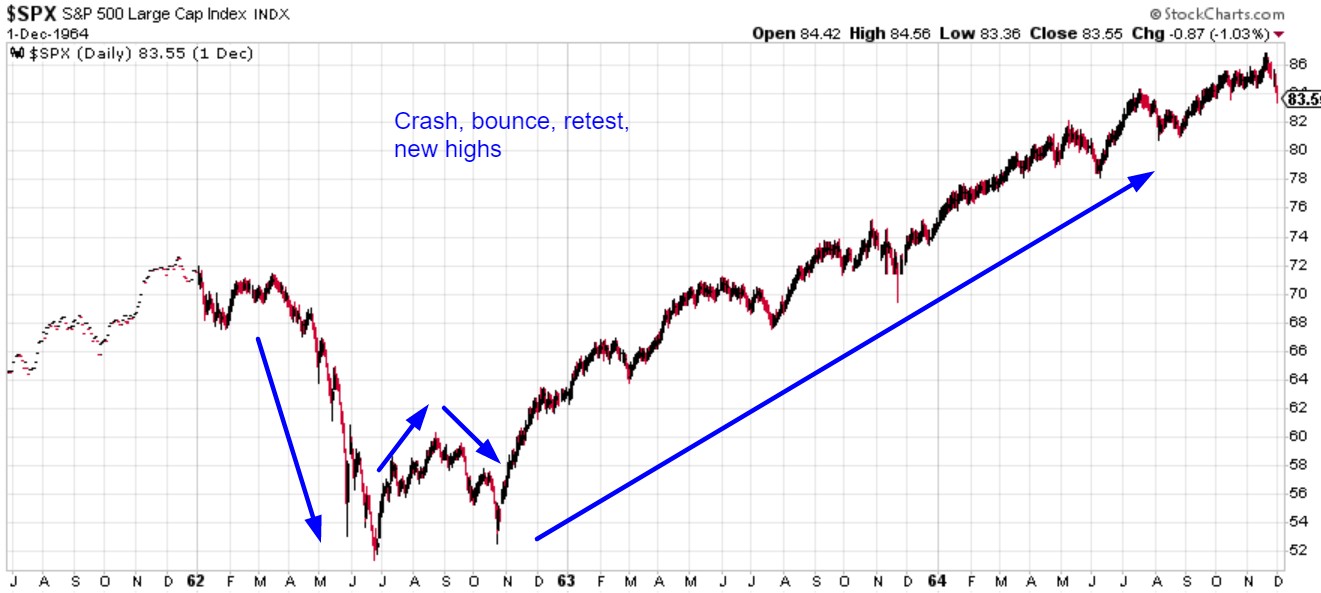
1962 - Crash, bounce, retest, new highs
This bear was caused first the President John Kennedy's standoff against the steel companies which began in the spring of 1962 then by the Cuban Missile Crisis in October.
New bull market due to: Both issues resolved. Economic stimulus spurred growth.
(Courtesy of https://www.investing.com/analysis/how-the-recent-stock-market-crash-is-just-like-1987-200371419 )
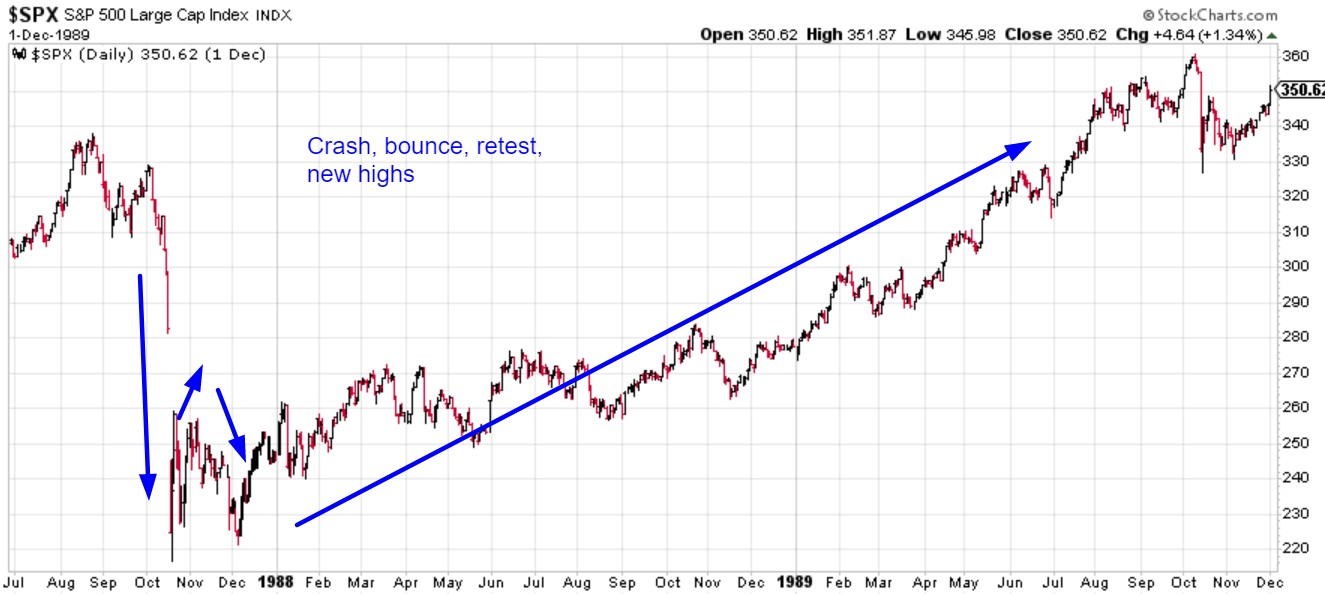
1987 - Crash, bounce, retest, new highs
This crash was brought on by a number of factors including a badly timed interest rate hike. Computer program-driven trading models that followed a portfolio insurance strategy as well as investor panic spurred the crash. No trading curbs existing in those days. There was also a takeover-tax bill, sent around several days before the crash to see how the measure would be received. Some believe this was the straw that broke the camel’s back in an environment that was already appearing to be a perfect storm for some kind of tumble.
New bull market due to: After the crash, trading curbs and circuit breakers were put in place to prevent such recurrences. In a statement on October 20, 1987, Fed Chairman Alan Greenspan said, “The Federal Reserve, consistent with its responsibilities as the Nation's central bank, affirmed today its readiness to serve as a source of liquidity to support the economic and financial system." Behind the scenes, the Fed encouraged banks to continue to lend on their usual terms. The Fed’s response to Black Monday ushered in a new era of investor confidence in the central bank’s ability to calm severe market downturns. Unlike many prior financial crises, the sharp losses stemming from Black Monday were not followed by an economic recession or a banking crisis due to the Fed's fast response to provide any needed liquidity via easy money policies. Former Fed Vice Chairman Donald Kohn said, “Unlike previous financial crises, the 1987 stock market decline was not associated with a deposit run or any other problem in the banking sector."
(Courtesy of https://www.investing.com/analysis/how-the-recent-stock-market-crash-is-just-like-1987-200371419 )
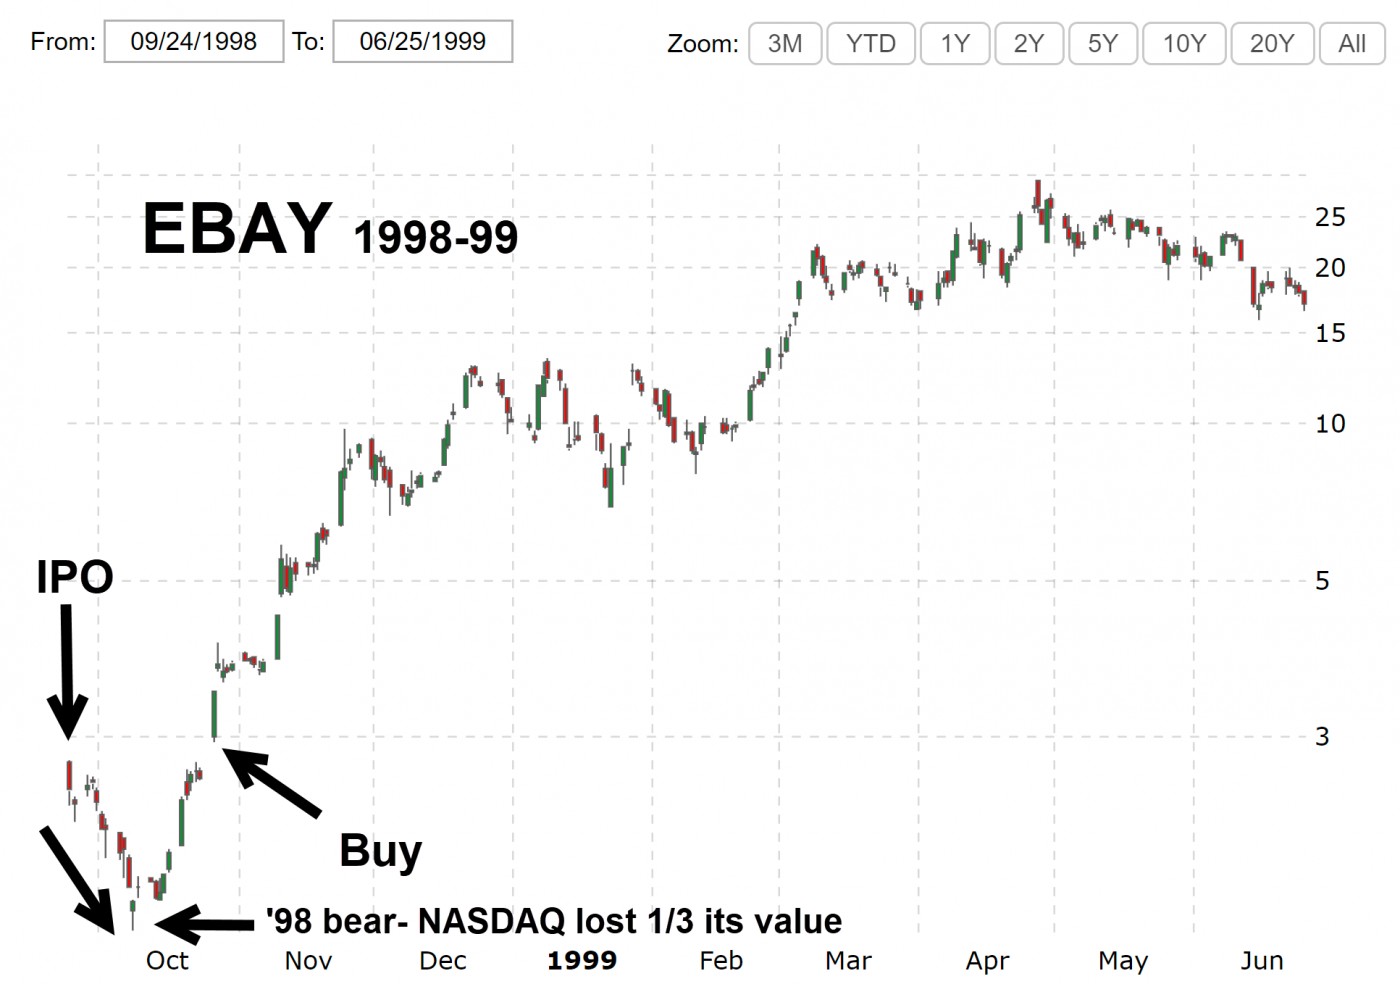
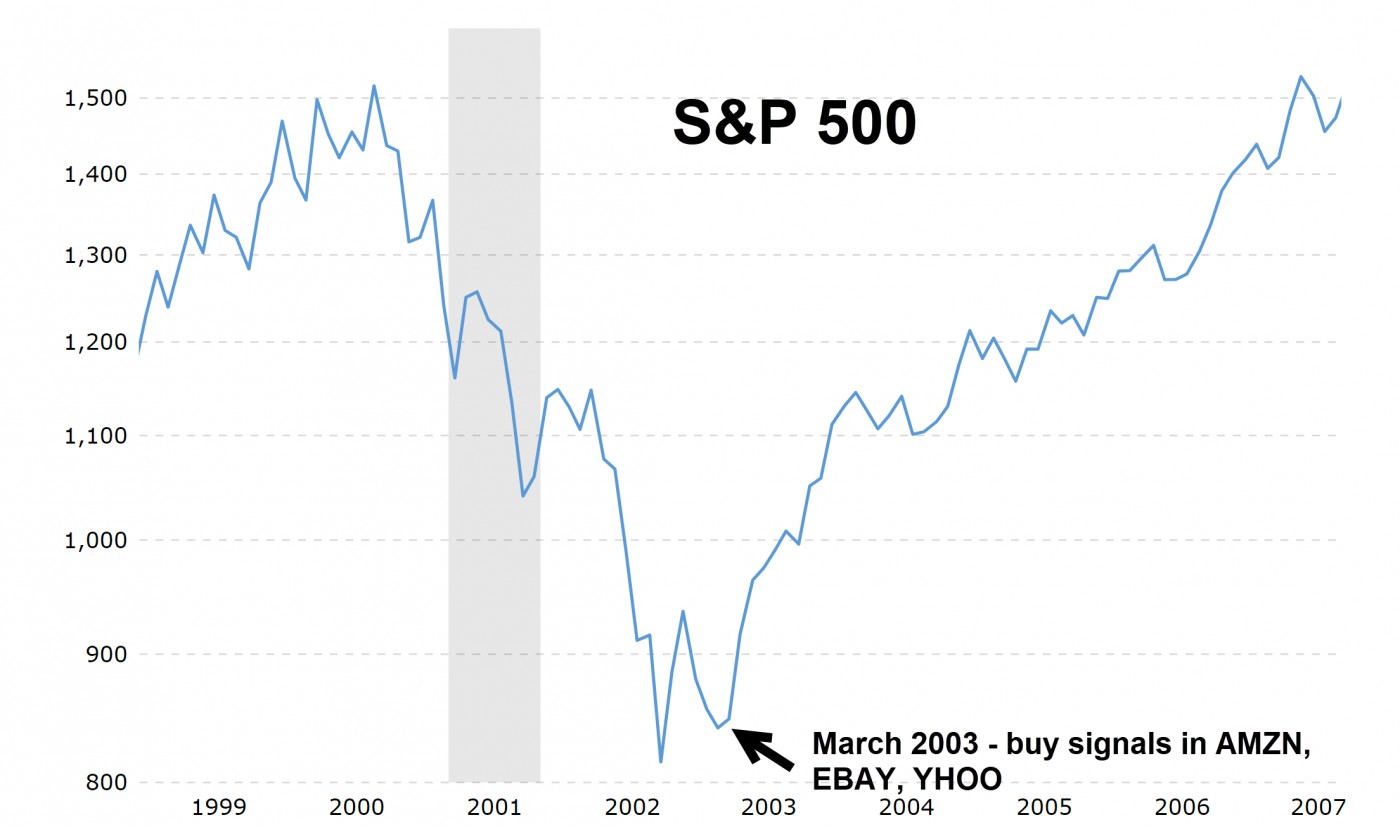
1998 - Crash, bounce, retest, new highs
This bear was brought on by the "Asian Contagion". After the bear ended, the top performers in late 1998 were the first to hit new highs. This included YHOO, EBAY, and AMZN. EBAY left an important clue in that it had first mover advantage, yet came public during the 1998 bear market. It promptly lost over 1/3 of its value but when the weight of the market came off, it created a U-turn pattern. Within a matter of days, it had eclipsed its IPO price by gapping to new highs. I called Bill O'Neil and told him this is your buy point. Of course, I bought a sizable position in the institutional account I was managing.
New bull market due to: Containment of the crisis. The Fed also had easy money policies in place to prepare for Y2K which was seen as potentially disastrous. Easy money created one of the most powerful bull market rallies in 1999 which created the dot-com bubble.
(Courtesy of https://www.investing.com/analysis/how-the-recent-stock-market-crash-is-just-like-1987-200371419 )
 (https://www.macrotrends.net/stocks/charts/EBAY/ebay/stock-price-history )
2011 - Crash, bounce, retest, new highs
This near-miss bear with averages down roughly -20% was brought on by the end of the second iteration of quantitative easing, or QE2. The Federal Reserve had no choice but to reinstate QE as came to be known as Operation Twist.
- QE2: November 2010 - June 2011.
- Operation Twist: September 2011.
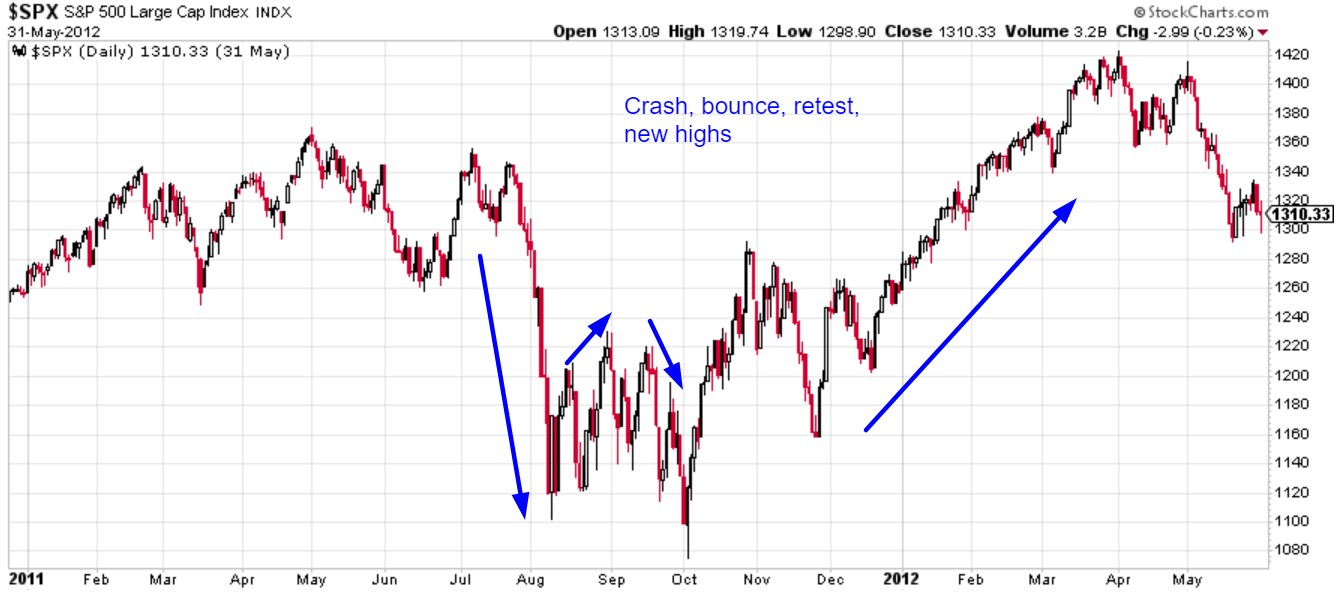
(Courtesy of https://www.investing.com/analysis/how-the-recent-stock-market-crash-is-just-like-1987-200371419 )
2000-2002
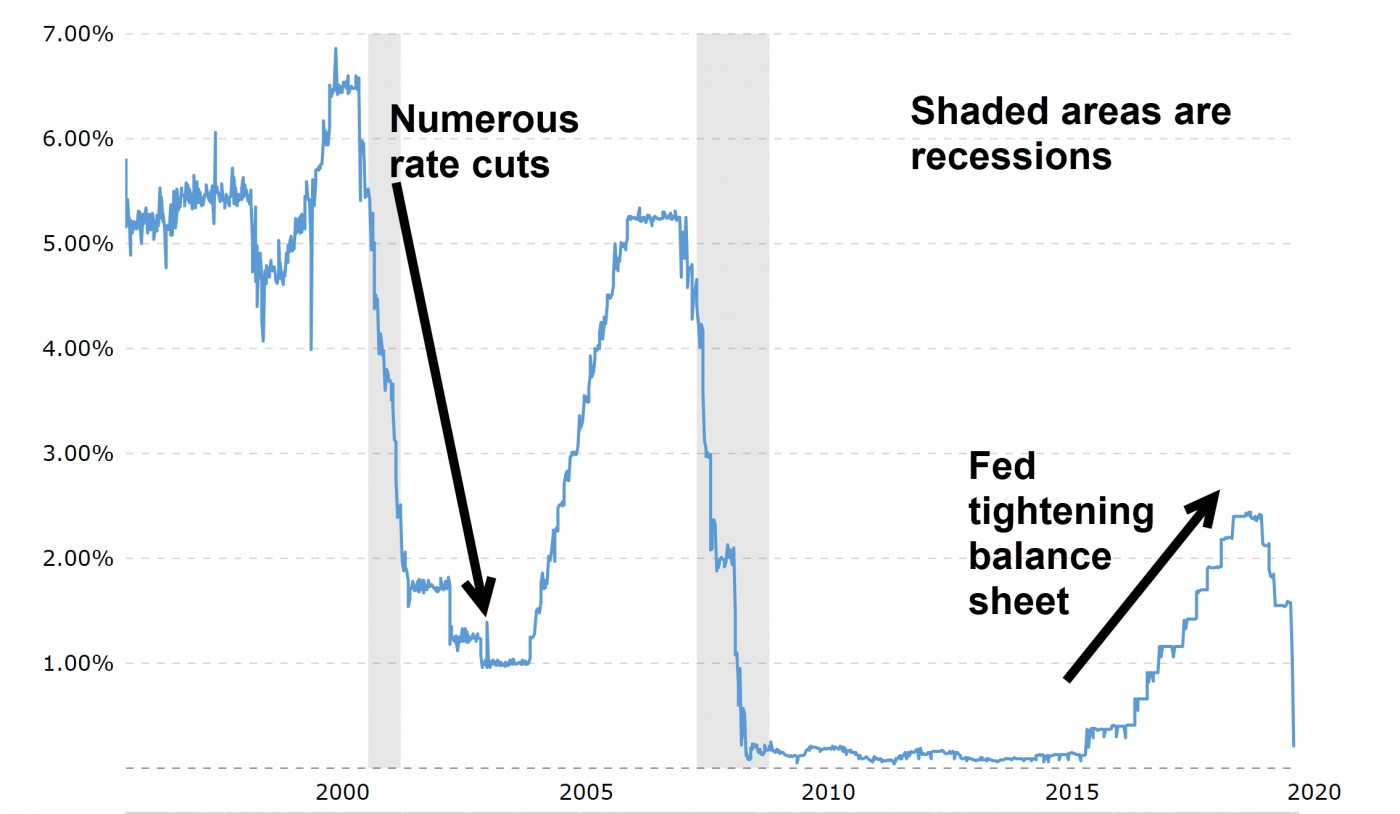
Post dot-com bubble, markets headed lower. Y2K turned out to be no issue so the easy money policies had to be undone. Furthermore, because dot-coms were in a bubble with most having deficient business models, the bubble blew apart. Without the easy money in place, recession hit by 2001. This prolonged the stock market correction. Markets did not recover until early 2003 as many internet companies between 2001-2002 (Webvan, Exodus Communications, and Pets.com) went bankrupt. An outbreak of accounting scandals (Arthur Andersen, Adelphia, Enron, and WorldCom) was also a factor and investor confidence suffered. The September 11, 2001 attacks also contributed heavily to the stock market downturn, as investors became unsure about the prospect of terrorism affecting the United States economy.
New bull market in early 2003 due to: Easy money, ie, low interest rates.
 (https://www.macrotrends.net/2015/fed-funds-rate-historical-chart )
Most of the weaker dot-coms had also been weeded out by then. This allowed the strongest ones (EBAY, AMZN, YHOO, etc) to thrive in the low interest rate environment. All issued strong buy signals in March 2003 as they had been outperforming the general market averages.
 (https://www.macrotrends.net/2324/sp-500-historical-chart-data )
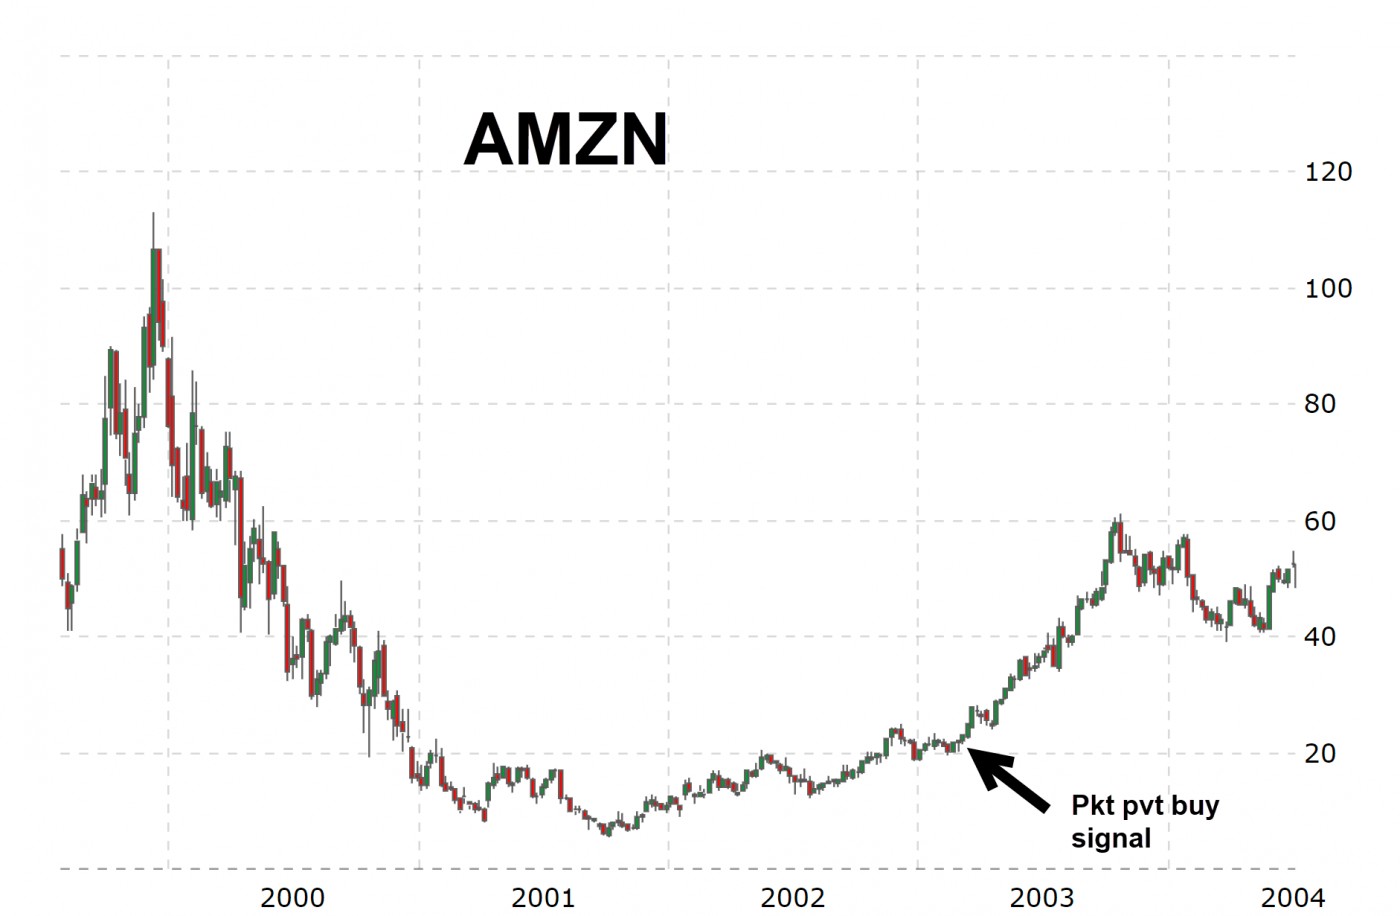 (https://www.macrotrends.net/stocks/charts/AMZN/amazon/stock-price-history )
1929
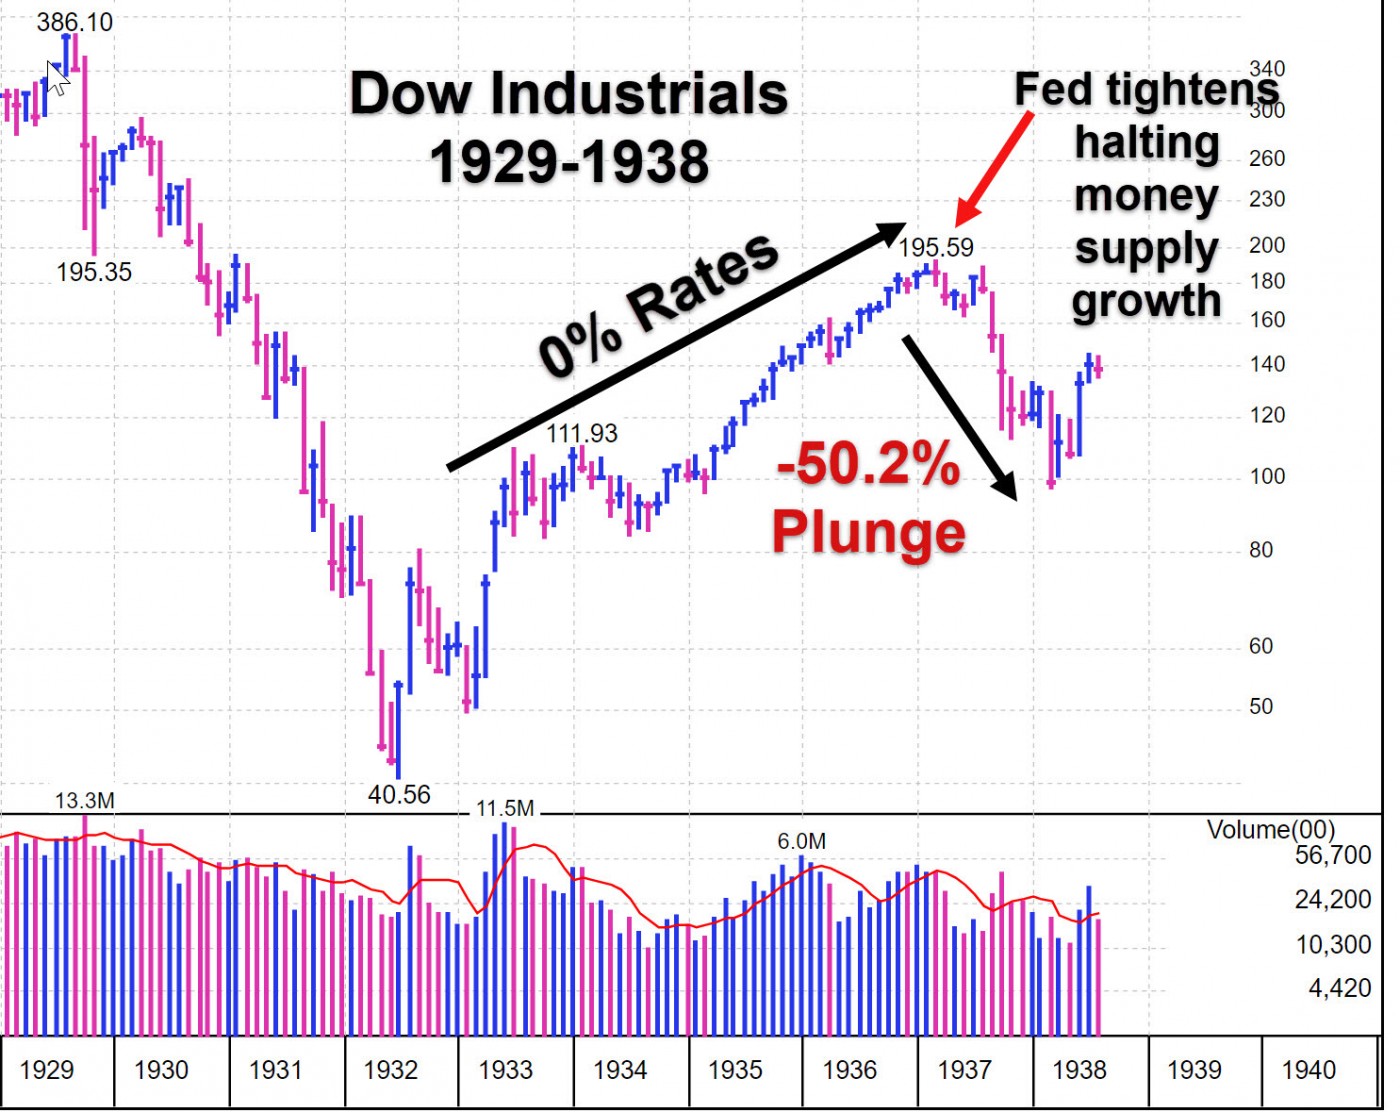
Roosevelt's crippling polices via the New Deal from 1933-1939 prolonged the depression, despite the big bounce in the major averages from 1932-1937, turning it into The Great Depression. From October 1929, the Dow Industrials lost 90% from peak to trough, bottoming in June 1932 after which it had its strongest up years on record with a gain of about 100% in 3 months off lows in 1932, then after a pullback, another 100%+ gain in 1933.
(https://newworldeconomics.com/the-federal-reserve-in-the-1930s-2-interest-rates/ )
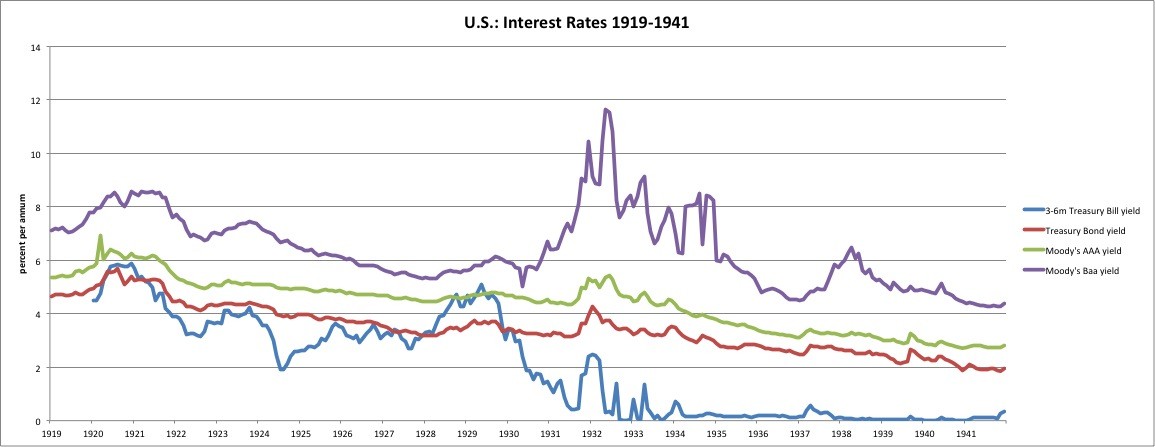
Back then, bank lending was more stringent, at least not on an overnight basis. Most of the overnight lending was to brokers, for margin loans. Margin was big in those days, up to 1930, as it was unregulated and people used leverage up to 10x on stocks.
In the chart below, the discount rate jumped toward the end of 1931 due to the devaluation of the British pound in September 1931. The British pound was the world’s premier gold standard international currency in those days. It set off turmoil everywhere, including dozens of “echo” devaluations since the British pound was also the premier reserve currency. This caused another wave of panic selling. But as can be seen in the chart above, rates were quickly brought back down, this time to 0% or near 0% where rates stayed, except for early 1934 when markets had a correction, then were quickly brought back down where they stayed near 0% until early 1937 when the Fed tightened causing a -50.2% plunge.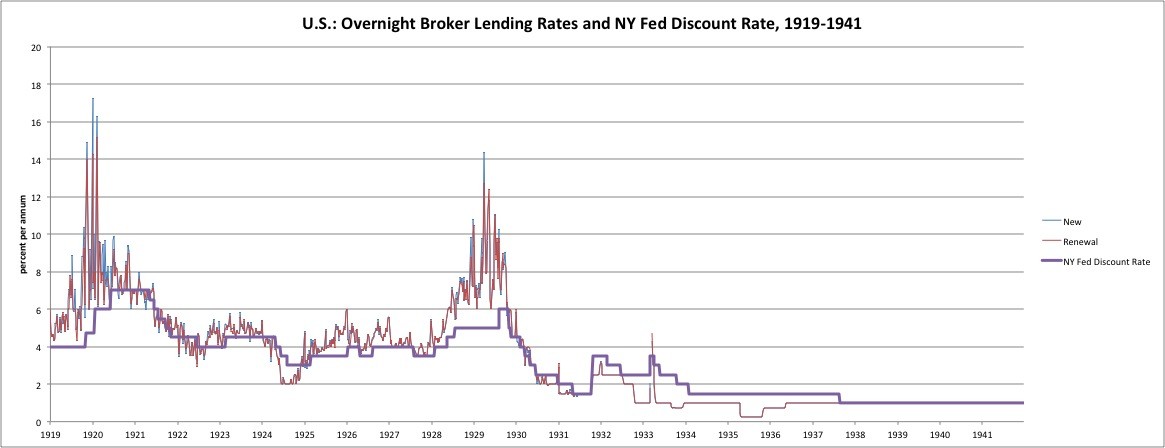
(https://newworldeconomics.com/the-federal-reserve-in-the-1930s-2-interest-rates/ )
New bull market beginning June 1932 due to: Super easy money policies. Low interest rates such as 0% or near 0% Treasury bill rates from mid-1932 to early 1937 not only pulled the stock market out of its downtrend, but the Dow Industrials and S&P 500 had their strongest market rallies in history.
1973-1974
The oil embargo of 1973 skyrocketed prices and crippled economies. A deep recession resulted as shown by the wide shaded area below.
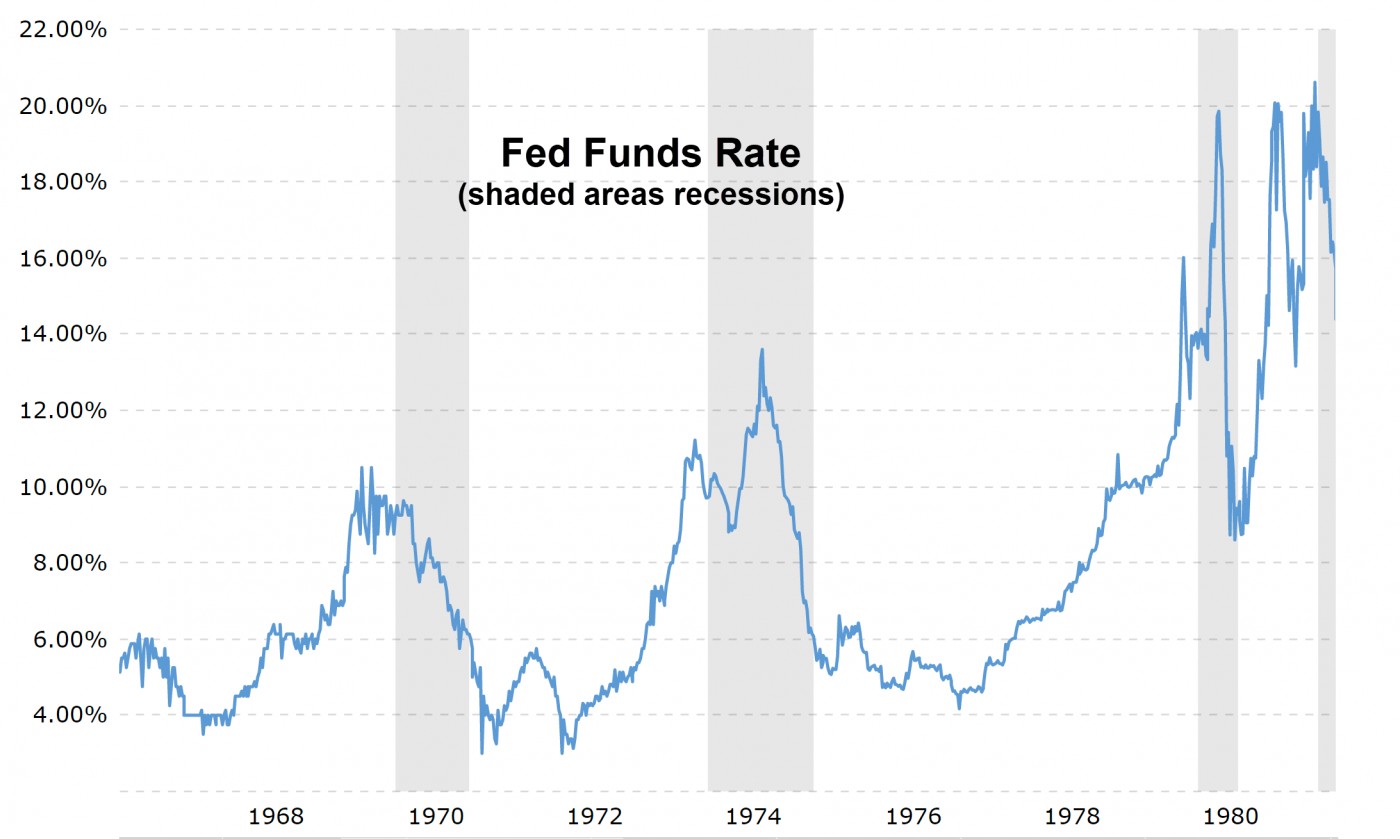 (https://www.macrotrends.net/2015/fed-funds-rate-historical-chart )
New bull market beginning late 1974 due to: Numerous rate cuts, ie, easy money policies.
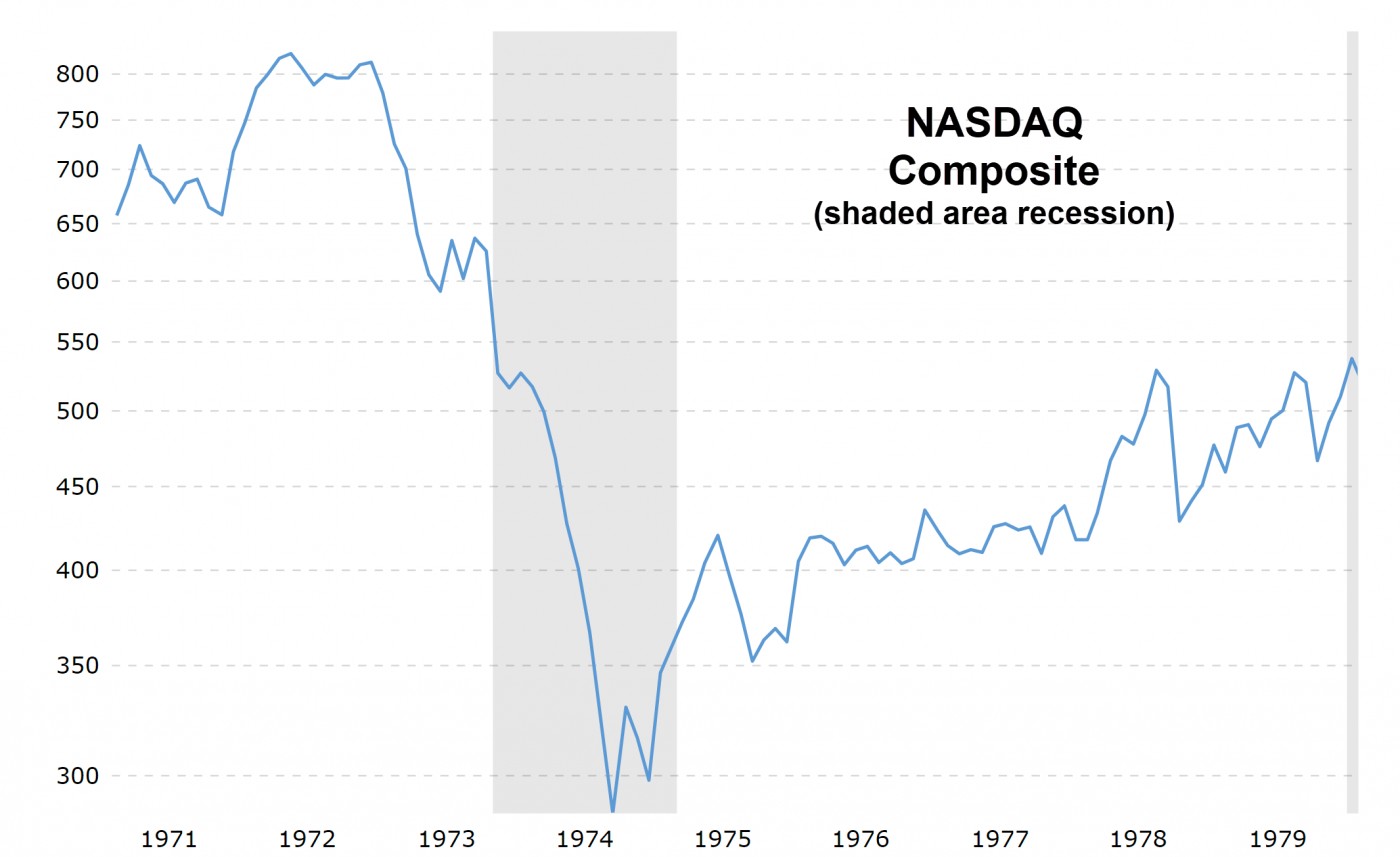 (https://www.macrotrends.net/1320/nasdaq-historical-chart )
2020
President Trump and global central banks have been providing record levels of stimulus, even beyond what was provided in the 1930s. Easy money has never been easier. Tax cuts, low oil, and numerous economic incentives as well as helicopter money all work to potentially minimize the length and depth of any recession. In other words, despite everything going from bad to worse, major averages found their lows. "Buy when there's blood in the streets" has always and still applies.
The first panic selling wave was due to the exponential rise in coronavirus cases. Any second panic selling wave which did not occur would have likely been due to the massive amount of damage done to the economy due to lockdowns, quarantines, and supply chain disruptions.
We Had A Recession
The recession was short and sharp. As we can see from the numerous key examples above, easy money policies always rescued then jump started the economy. Most bear markets were short, sharp shocks of the "Crash, bounce, retest, new highs" type. The few prolonged bear markets were due to reasons such as restrictions on bank lending (1930-) and devaluation of the world's reserve currency at the time (1931) or the oil embargo (1973) or the slew of exogenous events from 9/11 (2001) to accounting scandals (2000-2002) and of course the dot-com bust which took a couple of years to unwind (2001-2002). Still, in all three cases, easy money the key to helping stock markets find major bottoms.
Keep in mind the stock market can have declines of 20% or greater without a recession. This happened in 1962 (-28%), 1987 (-33.5%), 1998 (-21%), and 2011 (-20%). The massively stimulative measures could spur growth that could cushion or at least shorten the length of a recession even if it comes as a sharp panic-stricken shock based on any additional waves of panic selling discussed above.
Average 3 year nominal returns when buying a U.S. equity sector down x% since the 1920s:
Down 60% = 57%
Down 70% = 87%
Down 80% = 172%
Down 90% = 240%
Where to Next?
Interest rates are on the rise, but they’re still historically cheap. That’s partially because of the federal funds rate — a key borrowing benchmark set by the Federal Reserve. Nevertheless, as of Mar 30, 2022, the CME Fed Futures is pricing in an additional 7 rate hikes in 2022. Here is a useful link to the history of the federal funds rate: https://www.bankrate.com/
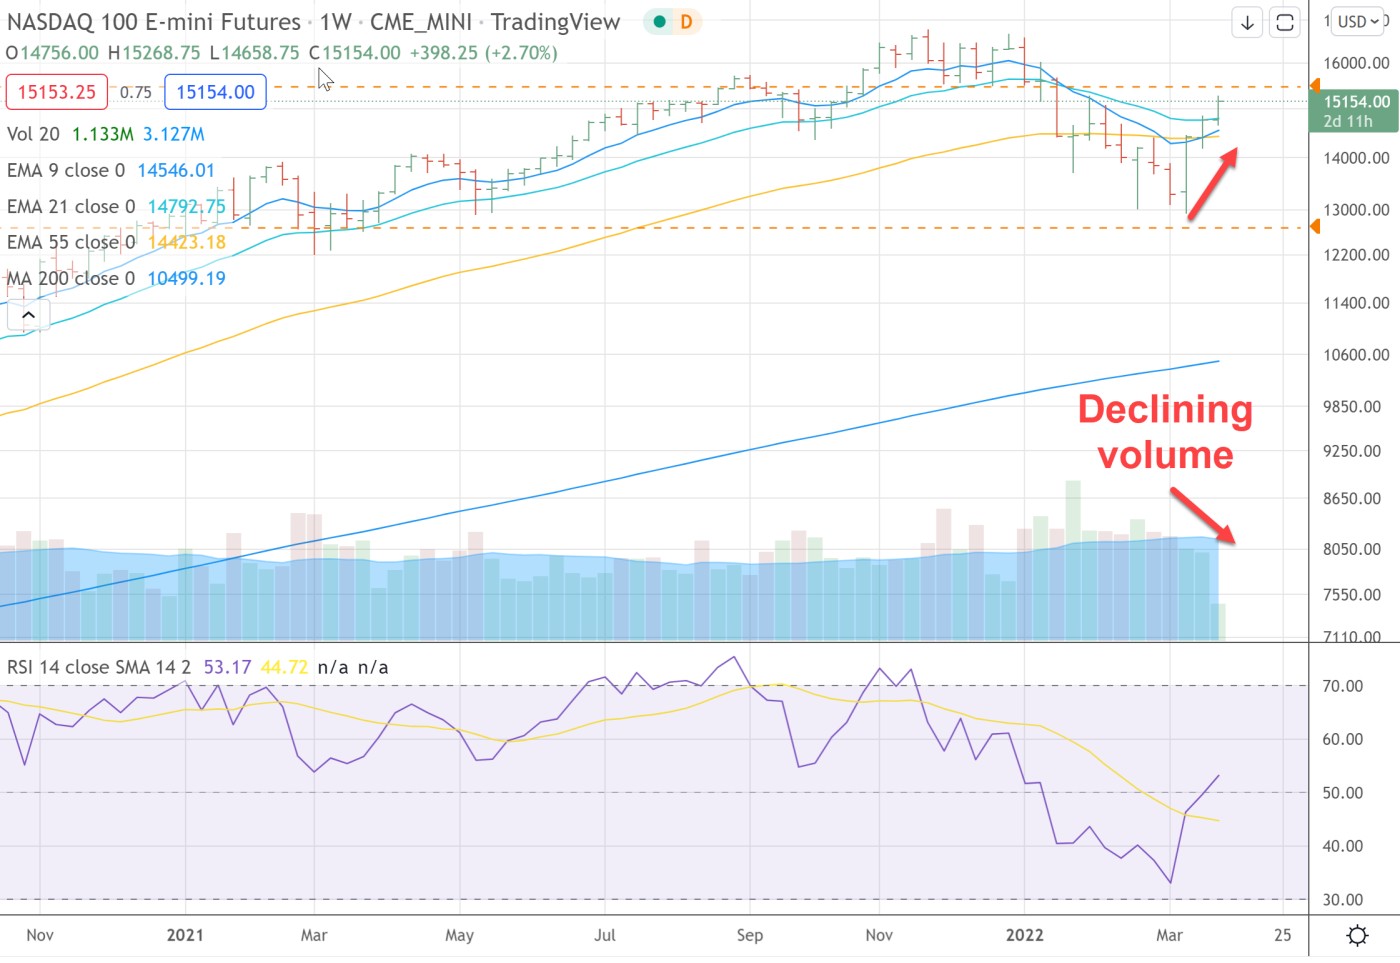
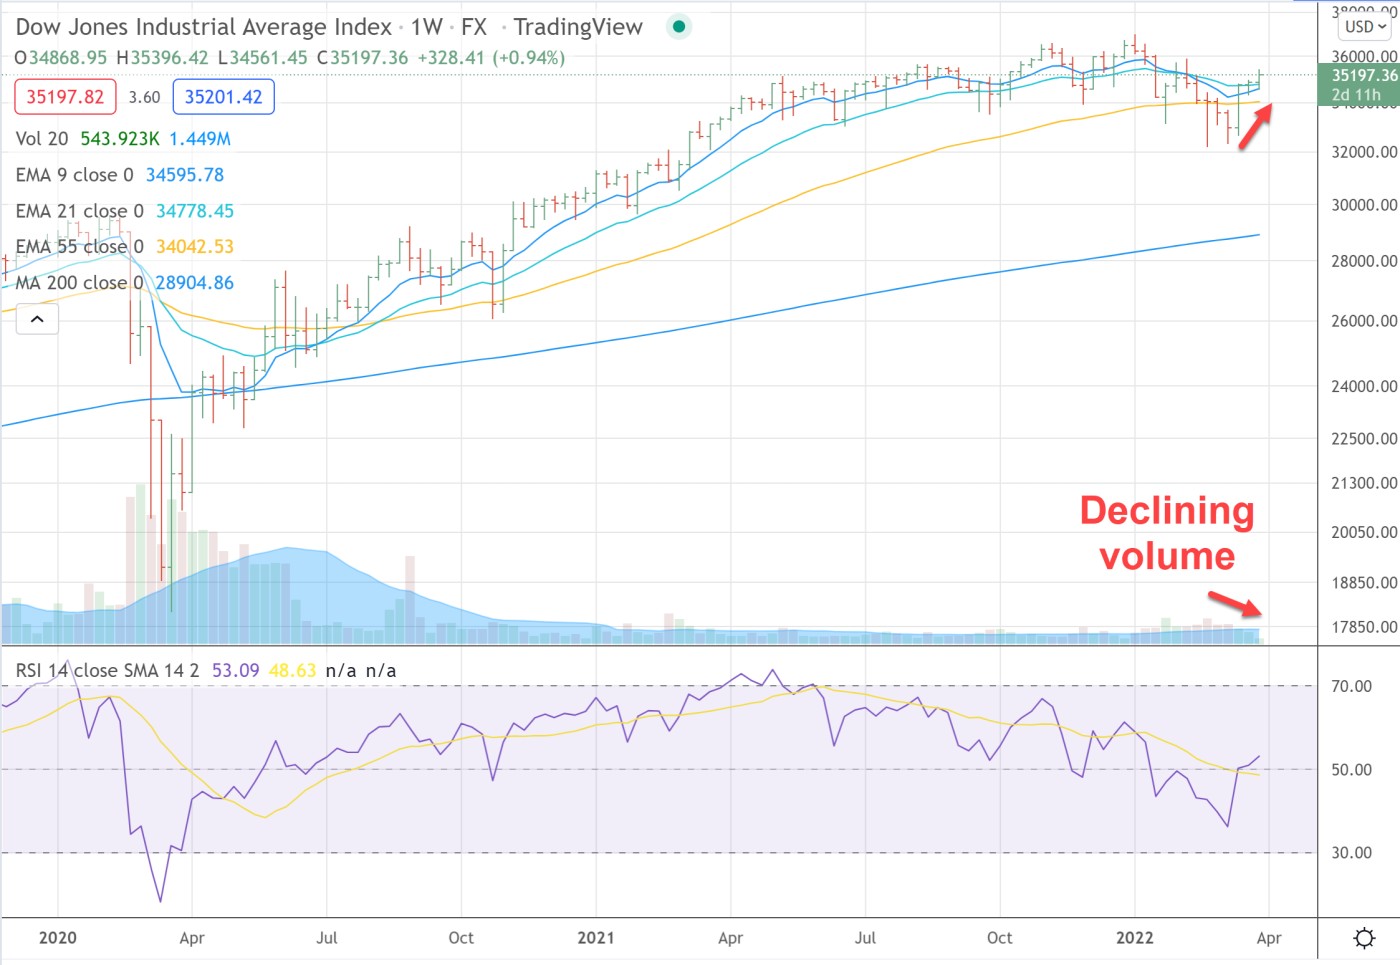
With debt at all time highs, rates near all-time lows, and soaring inflation, the Fed has been painted into the tightest of corners where they are forced to hike by token amounts which could push markets to new intermediate lows. This would force the fed's hand to reverse their hawkish stance in some form if history is any guide. The slowing or stopping of QE has always been a major headwind for cryptocurrencies as less capital is available. That said, supply shocks in both BTC and ETH are reaching all-time lows, but demand remains sluggish in terms of price/volume action in both. Stocks of course may struggle as well until there is hope Powell gives indication of the postponement of rate hikes as he did in prior periods such as in January 2016. The Fed will use the reason of supply chain issues due to higher order effects from C19, economic fallout from the Russia-Ukraine war, or war itself as justification for more money printing to justify a reversal of their hawkish stance. In the meantime, there is hope the situation between Russia and Ukraine will ease as well as short covering which is helping stock and crypto markets bounce as shown on the weekly charts below, but for how long?
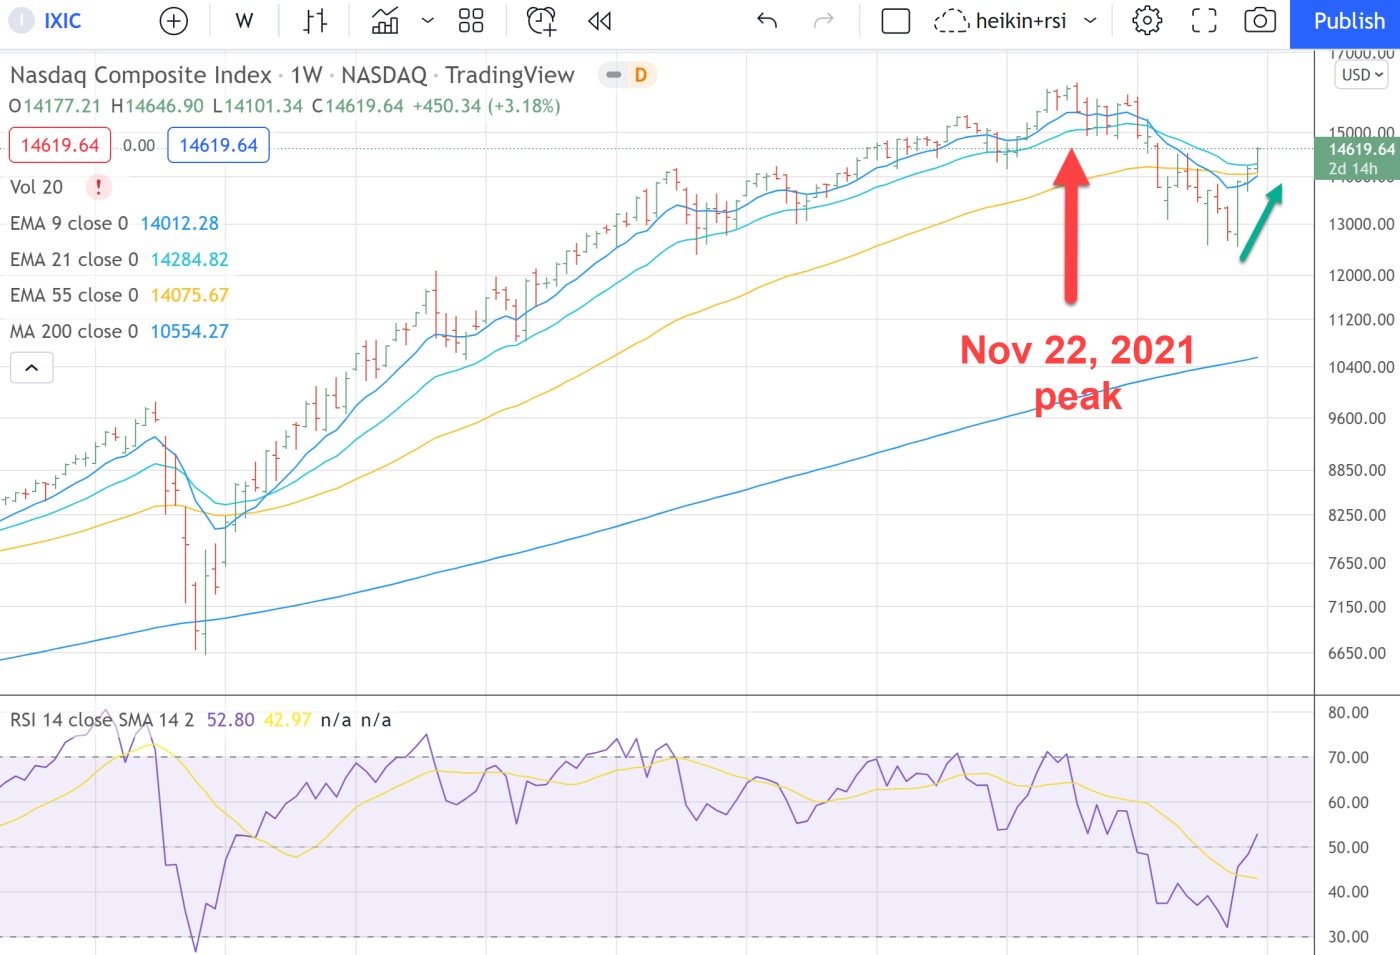
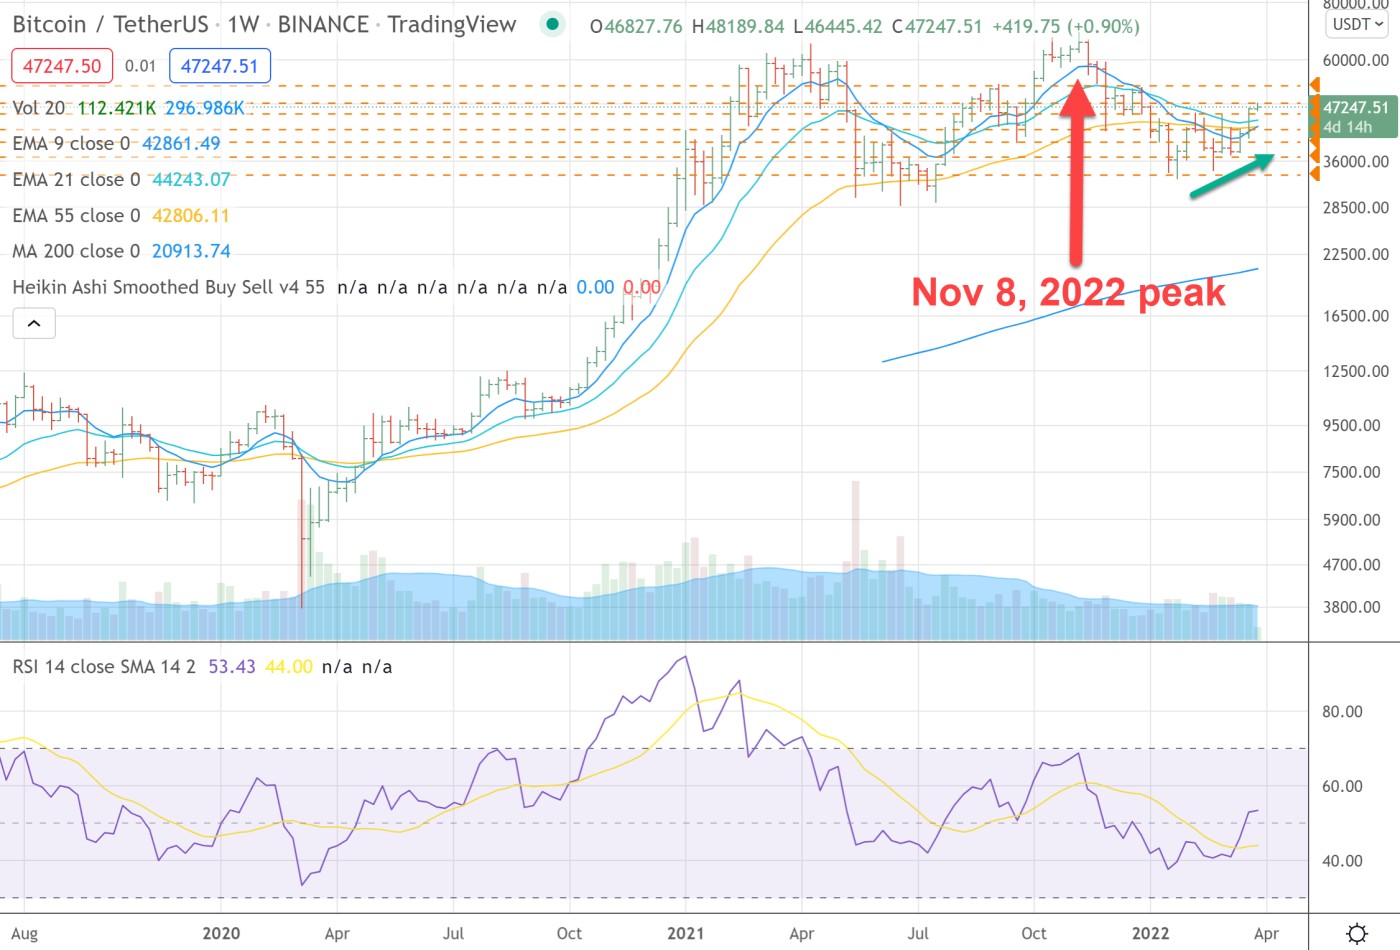
Price/volume action for both the major averages in stocks and in BTC and ETH remain anemic as shown in the bitcoin chart above and the stock/stock futures charts below.
We will be monitoring the situation as always but having small long and short exposure to the market can work to one's advantage given how some stocks can bounce into logical areas of resistance while other leading names such as AMD may attempt to push higher.