
A jump in **productivity inside the stack** is already happening. However, a jump in **customer revenue big enough to “justify” today’s capex on a clean ROI spreadsheet** is not proven yet. Those are different claims.
### What “recursivity” can actually do
Recursivity means AI writes code, designs chips, tunes kernels, places racks, and runs experiments:
- **It can stretch each GPU-hour.** Better compilers, sparsity, quantization, routing, and scheduling raise tokens per watt. That is real and is part of why Nvidia and the labs keep raising efficiency numbers.
- **It can ease some bottlenecks that are software or design-bound:** verification, RTL helpers, placement, firmware, cluster software, even some materials simulation. That shortens the *engineering* queue.
- **It does not print substations, transformers, water, or HBM wafers.** Power interconnect and advanced packaging stay physical. Recursion helps you use the scarce stuff better; it does not delete the scarce stuff.
- **It can raise demand as fast as it raises supply.** Cheaper tokens usually mean more tokens used (agents, longer context, more retries). Efficiency often *increases* capex appetite, not the opposite.
So recursion is a **capacity multiplier**, not an automatic capex off-switch.
### Will revenue jump enough to justify the spend?
For the build to look “earned” you need something like: AI products produce **large, recurring cash** (cloud inference, ads, seats, transaction take-rates) that covers depreciation on GPUs that age in a few years.
What Mag 7 / Nvidia earnings actually show:
- **Demand for compute is still above supply.** That supports *more* capex, not that ROI is already locked in.
- **Some AI product lines are growing fast** (cloud AI services, model APIs, coding tools). That is the beginning of a revenue ramp, not $2T+ of incremental profit.
- **Most hyperscaler AI revenue is still small versus the capex run-rate.** The bull case is that this is early and margins will show up after training clusters fill with inference. The bear case is that prices fall as fast as usage rises.
Nvidia’s strength is **selling the picks**. Its earnings can look excellent **even if** OpenAI/Anthropic/hyperscaler *end-customer* ROI is still messy. Those are not the same P&L.
A “huge jump” is plausible in **token volume and cloud AI billings**. A huge jump in **economy-wide profit** that neatly pays for $800B–$1.3T a year of infrastructure is a forecast, not a fact.
### The honest split
| Recursive AI helps | Recursive AI does not automatically do |
|---|---|
| More tokens per dollar of silicon | Guarantee software pricing power |
| Faster chip/software iteration | Create grid capacity |
| Lower unit cost of intelligence | Make every GPU cohort earn its keep before it is obsolete |
| New products (agents, coding, search) | Stop circular financing or overbuild risk |
### Bottom line
Mag 7 spend and Nvidia’s guide say: **buyers still want more compute than they can get**, and they are betting recursion + productization will catch the depreciation schedule. That is a coherent bet. It is not the same as “revenue has already jumped enough.”
Watch three numbers, not the word “recursive”:
1. **AI service revenue and margin** at Microsoft, Google, Amazon, Meta — not just capex.
2. **Utilization and inference mix** (training-heavy clusters that sit half-idle are a warning).
3. **Price per token vs tokens consumed** — if price collapses faster than volume grows, capex looks worse even while “AI usage” explodes.
Recursion makes the bull case *more* believable. It does not retire the ROI question.
Global liquidity vs markets
Global liquidity (typically measured via major central-bank balance sheets — Fed, ECB, BOJ, PBOC — plus broader credit/money-supply aggregates) has shown a very high multi-year correlation with the Nasdaq indices.
Analysts such as Raoul Pal have frequently highlighted charts showing correlations in the 90%+ range over 10–15 year periods. Post-pandemic data reinforces that the Nasdaq (especially growth/tech) is particularly sensitive to liquidity conditions compared with value or defensive sectors. When global liquidity expands robustly, it tends to support risk assets, multiple expansion, and capital flows into high-duration names like those that dominate the Nasdaq.
### Can the Nasdaq keep rising despite current AI/capex fears?
**Yes, it is likely** — and has happened before — provided global liquidity remains in a sustained expansionary regime.
- Sector-specific fears (AI overbuild, hyperscaler ROI questions, memory resets, custom-silicon competition) can cause sharp rotations or drawdowns *within* tech (as seen in the SOX and semiconductor names in mid-2026).
- However, broad Nasdaq performance is heavily influenced by the mega-caps and overall risk appetite. Strong liquidity often acts as a buffer: it supports valuations, encourages inflows, and can keep the index grinding higher even while individual sub-sectors correct.
- Historical precedent exists for the Nasdaq advancing through periods of narrative fatigue or cyclical concerns when the liquidity tide was rising.
### Current backdrop (as of late August 2026)
- Various global liquidity measures remain supportive in aggregate (BIS data showed robust growth in USD- and euro-denominated foreign-currency credit into early 2026).
- Some narrower “net liquidity” gauges have shown flattening or mild pressure in recent months, so the picture is not uniformly explosive.
- AI/capex concerns are real and have already produced volatility, but they have not yet broken the broader liquidity-driven framework for the Nasdaq as a whole.
### Important caveats
- Liquidity is a necessary but not always sufficient condition. Extremely high valuations, disappointing earnings delivery, aggressive rate shocks, or a sudden fiscal/credit event can still overpower liquidity support but this is temporarily such as yen carry trade crash in August 2024, Trump tariffs correction in April 2025, or Iran situation earlier this year. As long as global liquidity remains healthy, sharp rallies back to new highs are a standard.
- Concentration risk is elevated — a large portion of Nasdaq performance still hinges on a handful of mega-cap names whose individual capex and cash-flow stories matter.
- Liquidity itself can turn. Central-bank policy shifts, quantitative tightening acceleration, or a sharp rise in the dollar can reverse the tailwind quickly. This can create speed bumps that show up as the step back for every 3 steps forward, but as long as global liquidity continues at a healthy pace overall, the Market Direction Model should stay on a buy signal. This would result in far fewer signals with superior performance if history over countless market cycles would suggest.
**Bottom line**:
Robust ongoing global liquidity flows have historically been one of the strongest tailwinds for the Nasdaq and can allow it to continue higher even while AI/capex fears create noise and sector rotation. The key variable to monitor is whether that liquidity expansion remains durable. If it does, the path of least resistance for the Nasdaq stays upward; if it stalls or contracts, the same fears that are currently “digestible” become much more dangerous.
Nevertheless, global money creation is expanding at a historic pace.
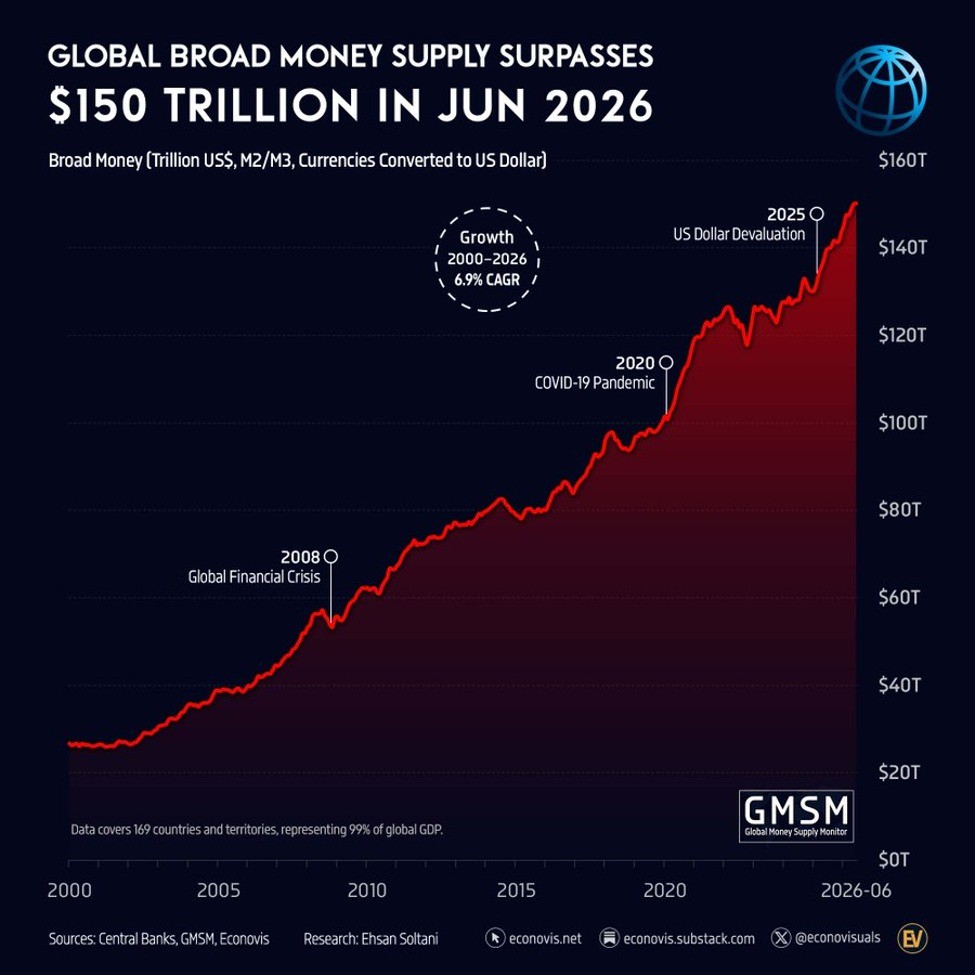
On Market Direction Model
Tracking global liquidity along with rare unusual price/volume action such as in 2008 and 2020 before the crash (which pushed MDM into a sell signal) yielded superior returns over the decades.