
Part 6 – The Six Essential Rules of Short-Selling
By Gil Morales, Managing Director, MoKa Investors, LLC
Now let’s talk about when to take profits, arguably the most fun part of short-selling and the whole point selling stocks short in the first place! Our final rule, #6, covers this most important aspect of the short-selling process.
Rule #6: Once a short position is showing a profit, set a downside profit target objective of 20-30% or use a “layering” technique, covering ½ the position once a 15-20% profit is showing, and the other ½ at a 20-30% profit. Alternatively, once a short position is showing a good profit one can use the 20-day moving average as a guide for a trailing stop. If the nearest moving average above the stock’s current price is the 50-day or 200-day moving average then that can be used in place of the 20-day moving average line. Watch also for undercuts of prior lows as potential rally points at which all or part of the position can be covered.
Because stocks will often have sharp upside rallies within their macro-downtrends, it is wise to set reasonable profit objectives for any downside move you expect a stock to make once you have taken a short position in the stock. In most environments profit targets should be 20-30%. If you find that short positions are breaking closer to 15-20% before rallying and wiping out your profits, then you can adjust this, or again use a “layering” technique where you cover ½ the position when it is showing a 15-20% profit and the remainder when it is showing a 20-30% profit.
Alternatively, the 20-day moving average can sometimes be used as a guide for a trailing upside stop on any short position that is showing a decent profit. Once a stock has broken down from a proper short-sale set-up and topping formation and has been in a downtrend for at least a few days to a few weeks, the 20-day is often a useful reference point for a legitimate upside turn and rally in a stock, and hence offers what can be a nearby trailing stop.
There is also the much simpler “Piggy Principle,” whereby one covers a short position when one is feeling quite fat and happy over the whole affair. From a contrarian, psychological standpoint, I have found that this is often a useful indicator to throw into the mix in determining when to cover profitable short positions!
Another method that I favor is “working” a short position based on the “undercut & rally” phenomenon I have observed in stocks as they top and begin their longer-term price declines. As a stock comes down it will start to undercut prior support levels in the chart, and often these undercuts of prior lows in a pattern set up reaction rallies back to the upside.
The reason for this is somewhat intuitive. If a breakdown through a “support” level is viewed by the crowd as “bearish,” this is where natural sellers will be washed out of the stock and short-sellers will swarm the stock on the short side as they see the breach of support as indicative of further, impending downside. Thus, as everyone leans over to one side of the boat at the same time, selling is washed out in the short-term and the stock then rallies back up through the previously breached support level.
In practice this approach works best since flexibility is required at all times on the short side. While making a practice of taking 20-25% profits in short positions when you have them is sound, the practical problem with that is sometimes the downside move is more within the 10-20% range, and using the “undercut & rally” method is generally more accurate in terms of know when to take profits.
The chart of Skyworks Solutions (SWKS) from 2015 below shows the various undercuts of prior lows and the rallies that followed each undercut as the stock declined off the June 2015 peak. SWKS topped in June of 2015 and rolled lower after forming a “fractal” head and shoulders formation between early June and late July.
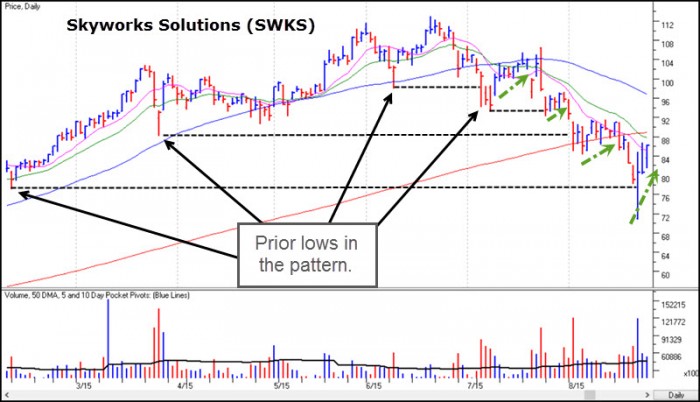
The entire downtrend off the peak consists of a series of undercuts and rallies as the stock moves lower. Notice that each rally eventually found resistance near or at a key moving average or other area of congestion/overhead resistance before the stock rolled over again. These rallies following the undercut cover point offered potential short-sale re-entry opportunities. In this manner, profits are taken on the way down, with the idea of potentially re-entering the trade higher up in the pattern after a short reflex rally.
Stocks can break down rapidly during market corrections or bear phases. However, during longer-term downtrends very sharp rallies can occur, and short-sale profits can evaporate rather quickly. For that reason, knowing when to take profits in an active manner is a critical part of successful short-selling.
Portions of this article have been excerpted from “Short-Selling with the O’Neil Disciples: Turn to the Dark Side of Trading” by Gil Morales & Chris Kacher, published by John Wiley & Sons in April 2014.