by Dr. Chris Kacher
Populism and bifurcated markets
There has been a real and widening gap between the “haves” (top 10–15%) and the “have-nots” (bottom 70–75%). This is what economists often call a **K-shaped recovery** or **bifurcated economy**.
### Why This Is Happening
- **Top 10–15% are doing very well**:
This group is heavily invested in tech, AI, stocks, and high-skill jobs. They benefit from rising asset prices, strong wage growth in tech/finance, and AI productivity gains. S&P 500 companies (especially Magnificent 7 and AI-related firms) are posting record profits and raising guidance.
- **Bottom 75% are struggling**:
This group relies much more on wages, not investments. They are being hit by:
- Persistent high prices (even if inflation has cooled)
- Stagnant real wage growth for lower/middle income
- High credit card debt and interest rates
- Reduced government stimulus compared to 2020–2022
### Evidence
- **McDonald’s** warning about low-income customers (<$45k/year) cutting back visits is very significant. This is usually the most resilient consumer group.
- **Whirlpool** reporting the weakest appliance demand since the 2008 recession and slashing guidance shows middle-income homeowners are delaying big-ticket purchases.
- The contrast is stark: Big Tech/AI companies are thriving while traditional consumer companies serving the mass market are clearly weakening.
### Important Nuance
This bifurcation is **real**, but not total collapse:
- The bottom 75% are not all struggling equally — many are still spending on small items (as Whirlpool noted).
- Unemployment is still relatively low.
- The top 10–15% + strong corporate earnings are keeping the stock market and overall GDP looking healthy.
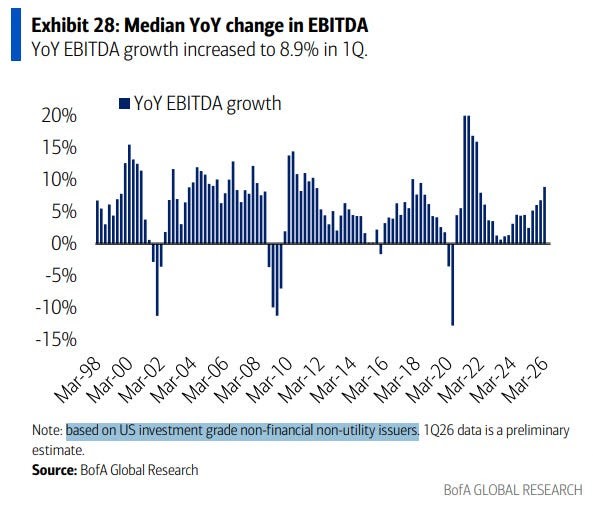
Recession odds have fallen to 17% while the medium YoY change in EBITDA is the highest in more than 4 years.
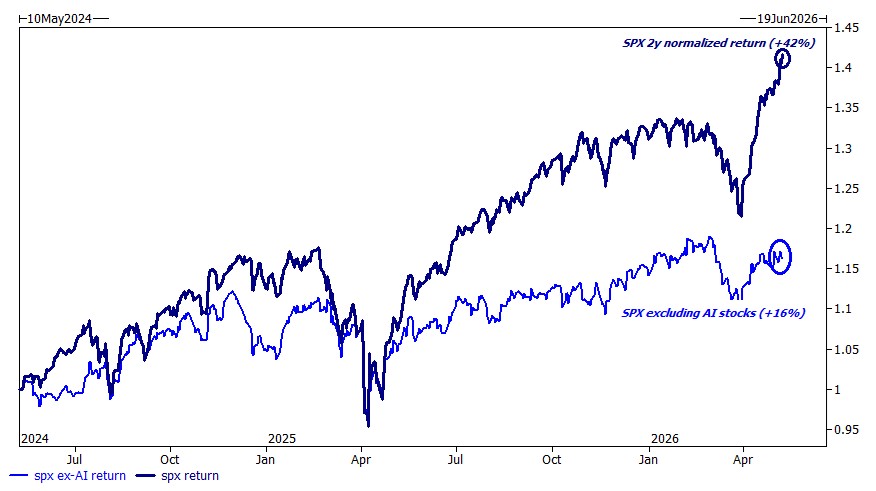
But since early 2024, if you weren't in the AI trade or in a major tech-exposed index, then you underperformed the market by 26% coming in at 16% vs 42%.
This creates a **tale of two economies**:
- One economy (tech, AI, finance, asset owners) is booming.
- The other (main street consumers, discretionary goods, housing-related) is under pressure.
This divergence is one of the **biggest risks** for the market in 2026–2027. If the bottom 75% continues to weaken, it could eventually drag down corporate earnings even in the "strong" sectors. But AI continues to drive GDP acting as a supercharged tailwind as well as the recursively exponential effects that can drive inflation down due to eventual supply-side deflation despite the ongoing bottlenecks. How the order of events unfold will be key. As always, focus will be placed on leading stocks in leading groups alongside real-time monitoring of macro events which often determines one's total exposure to stocks in their portfolio. Conservative traders may only go 100% long while more aggressive ones may go 200% long or higher when market conditions warrant.
Infinite liquidity
Adding considerable momentum to the tailwind is the AI arms race between the United States and China, combined with ongoing wartime spending needs. Both superpowers are locked in a high-stakes competition for technological supremacy, and neither side can afford to slow down. This dynamic is forcing central banks — especially the Federal Reserve — to keep liquidity flowing generously. The result is a market environment that remains structurally bullish for stocks, particularly those tied to AI infrastructure and real earnings growth.
Two concepts explain why this spending will keep accelerating. **Jovan’s Paradox** shows that the more efficiently AI reduces costs in one area, the more demand it creates elsewhere, leading to even greater overall consumption of compute and energy. The **Red Queen Effect** adds that companies and nations must run faster and faster just to stay in place — standing still means falling behind in the global race. Together, these forces create a self-reinforcing cycle where AI investment begets more AI investment, regardless of short-term ROI concerns.
That said, this liquidity party carries real risks. If central banks are forced to print aggressively to fund both the AI buildout and geopolitical needs, we could eventually see higher inflation, asset bubbles, or a painful reversal when the music stops. Historical liquidity orgies have often ended badly.
However, there is a strong counterbalance: **AI is also creating powerful supply-side deflation**. As the technology scales, it drives down the cost of intelligence, automation, energy efficiency, and production across many industries. This deflationary force can offset much of the inflationary pressure from increased money supply. In other words, the same AI arms race that requires massive liquidity may also generate the productivity gains needed to absorb it without runaway inflation.
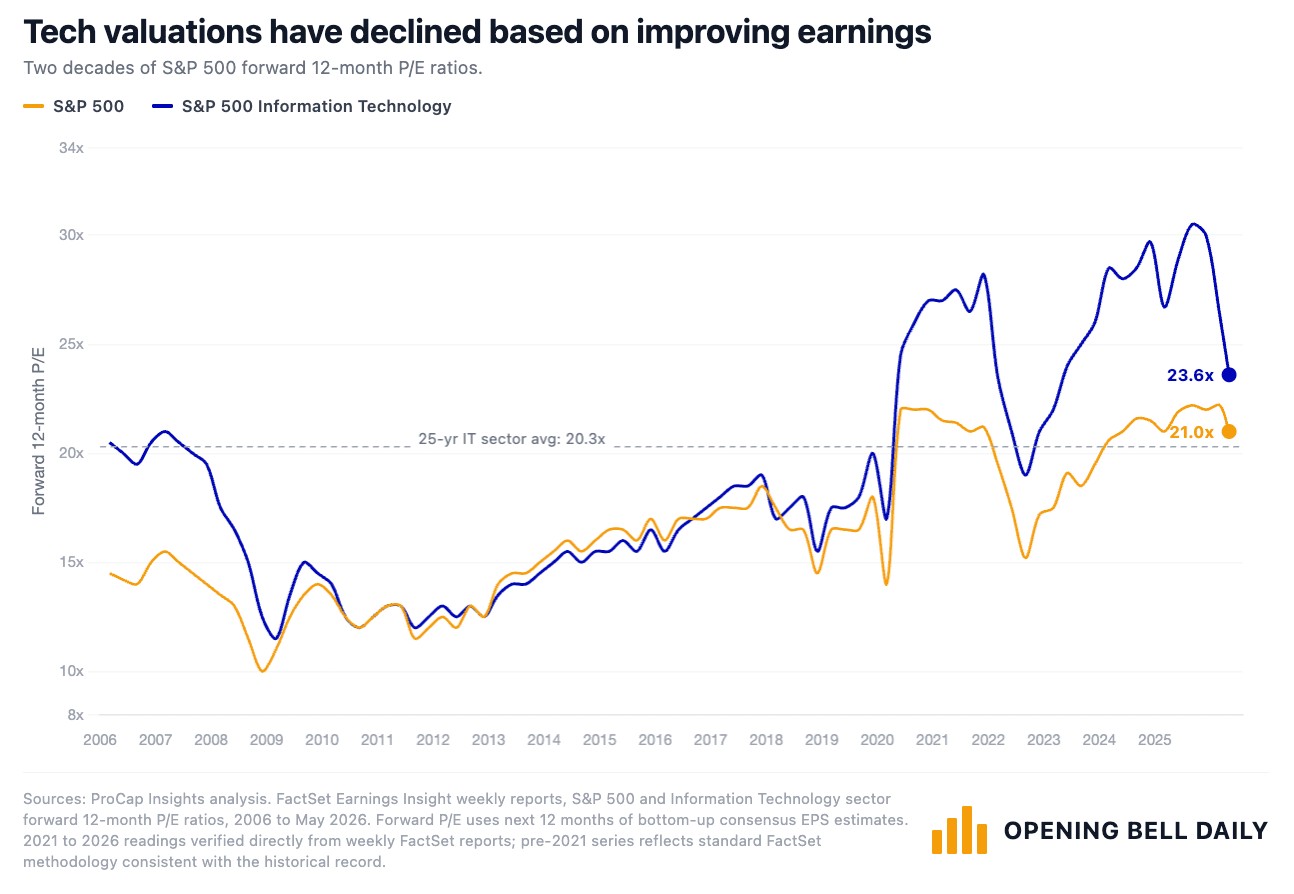
Further, tech valuations have declined due to improved earnings, not the action you see near a market top. But again, nothing goes up in a straight line forever, so it will be a question of how events unfold as to how volatile things get.