Major market averages logged their third distribution day since the February 9th lows, selling off late in the day on increased selling volume as they cascade off their highs of three days ago. With a cluster of distribution days coming so soon after the confirmation day suggests the pullback is not over. The
S&P 500 and
Dow Jones Industrials Indexes both dropped back below their 50-dmas.
Futures are roughly flat ahead of Fed Chairman Jerome Powell's resumption of his semiannual testimony on monetary policy at 10:00 AM ET. He noted on Tuesday that his economic projections have increased since the December FOMC meeting. This caused Tuesday's sell off as it prompted speculation that the Fed might hike rates four times this year.
The PCE Price Index, the Federal Reserve's preferred measure of inflation, increased 0.4% in January matching estimates, while the core PCE Price Index, which excludes food and energy, increased 0.3% also matching estimates. Year-over-year, the core PCE Price Index is up 1.5%, unchanged from the last reading.
Separately, the latest weekly initial jobless claims count totalled 210,000 vs. est 227,000.
Futures rallied on the news.
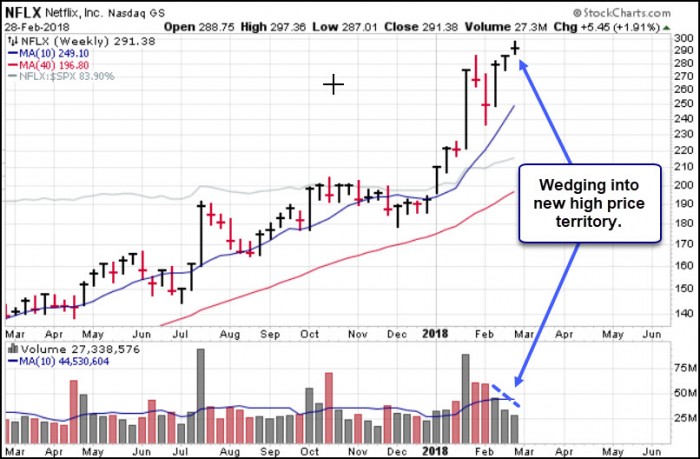
Focus List Notes:Both
AMZN and
NFLX remain in vulnerable deep v-shaped formations that have gone straight down and straight back up to new highs. On the weekly charts, both stocks have been wedging into new high price ground. The example of NFLX, below, shows a wedging rally on the weekly chart as the weekly price range compresses in a straight-down-and-straight-up formation. From the perspective of the weekly chart, there is no true base here from which the stock is breaking out.
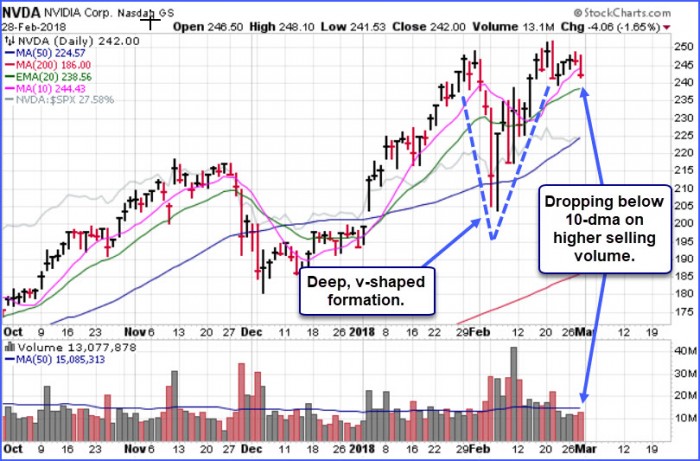
 NVDA
NVDA has dropped below its 10-dma and appears set to test its 20-dema. This is another deep, v-shaped formation that looks vulnerable to further downside, particularly if it cannot hold near-term support at the 20-dema.
This information is provided by MoKa Investors, LLC DBA Virtue of Selfish Investing (VoSI) is issued solely for informational purposes and does not constitute an offer to sell or a solicitation of an offer to buy securities. Information contained herein is based on sources which we believe to be reliable but is not guaranteed by us as being accurate and does not purport to be a complete statement or summary of available data. VoSI reports are intended to alert VoSI members to technical developments in certain securities that may or may not be actionable, only, and are not intended as recommendations. Past performance is not a guarantee, nor is it necessarily indicative, of future results. Opinions expressed herein are statements of our judgment as of the publication date and are subject to change without notice. Entities including but not limited to VoSI, its members, officers, directors, employees, customers, agents, and affiliates may have a position, long or short, in the securities referred to herein, and/or other related securities, and may increase or decrease such position or take a contra position. Additional information is available upon written request. This publication is for clients of Virtue of Selfish Investing. Reproduction without written permission is strictly prohibited and will be prosecuted to the full extent of the law. ©2026 MoKa Investors, LLC DBA Virtue of Selfish Investing. All rights reserved.
