fb
X
X
Tired?
Unfocused?
Off your game?
Read our free, updated as of Mar 3, 2022, Dr K report on how to optimize your mind and body so you can boost your focus when trading the markets.
YES, SEND ME THE REPORT !
Meet Dr K !
Chris Kacher
  • Nuclear physicist
  • Stock & crypto market wizard
  • Blockchain builder
  • Bestselling author
  • Top 40 charted musician
  • Biohacker
  • Former computer hacker
YES, SEND ME THE FILE !
YES, SEND ME BOTH !
Your email will always remain private.

Market Lab Report - Premarket Pulse 10/30/17 - The Great Unwind

Major averages shot higher on higher volume, closing near the top of their trading ranges.  Super-cap technology names such as GOOGL, AMZM, MSFT, and INTC all had strong earnings reports. Friday's NASDAQ move was its largest one-day percentage gain since November of 2016. Prior to Friday's move, the NASDAQ's price/volume action appeared to be deteriorating, but in this QE market a single day's action can suddenly right the situation, catching investors by surprise.

Over in Europe, the European Central Bank decided to leave interest rates unchanged and announced that it expects to lower its monthly asset purchases to EUR 30 billion from EUR 60 billion in January. That pace of purchases is expected to continue until at least the end of September 2018. 

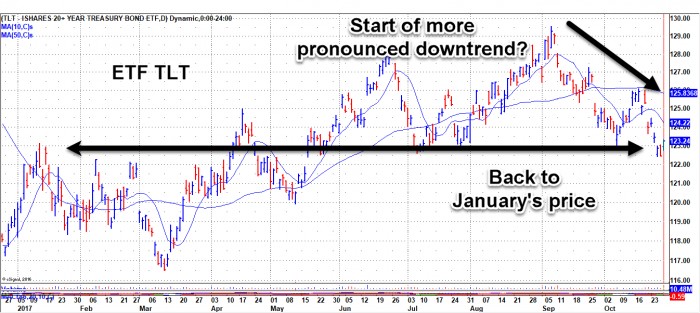
So The Great Unwind which began in the spring of this year will accelerate and begs the question how stock and bond markets will react. Will it be the straw that finally crashes the camel? ETF TLT which tracks the price of the US treasury 20+ year bond index has been trending lower since September. And that's after weakly trending higher in wide bands all year. In fact, TLT is back under its 200dma and at the same price it was in January. Perhaps this is the beginning of a more pronounced downtrend in the price of long bonds?

With centrals banks aware of such a possibility, The Great Unwind may turn into the Endlessly Infinite Unwind. Just as the market has baby-stepped higher, we would most likely see central banks slow their unwinding process should the stock market start into a major correction as we saw in the early years of QE such as in 2010 and 2011. The US Fed was quick to launch QE 2 then QE 3 as well as Operation Twist to counter falling markets. Certainly, they don’t want to undo the artificially created bubble QE has created in the US stock market since 2009. But of course, bubbles are bubbles because they do eventually burst. When global debt has become this massive, there has never been a soft landing.

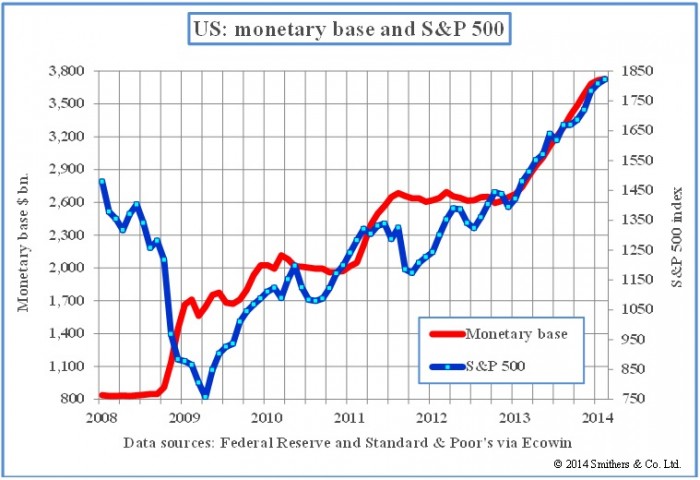
The chart below shows the high correlation between the S&P 500 and monetary base, both which were pushed higher by QE. When central banks unwind their balance sheets, their respective monetary bases will shrink. Should central banks unwind too quickly, the S&P 500 will most likely follow any downtrend in the US monetary base. Thus, the monetary base may end up decreases at an ever-slowing pace, thus the implication of the Endlessly Infinite Unwind.

3,800  3,500  3,200  2,900  2,300  2,000  1,700  1,400  1,100  800  US: monetary base and S&P 500  —Monetaly base  &P 500  2008  2009  2010  2011  2012  2013  2014  Data sources: Federal Reselve and Standard & Poor's via Ecowin  1850  1750  1650  1550  1450  1350  1250  1150  1050  950  850  750  @ 2014 Smithers cm

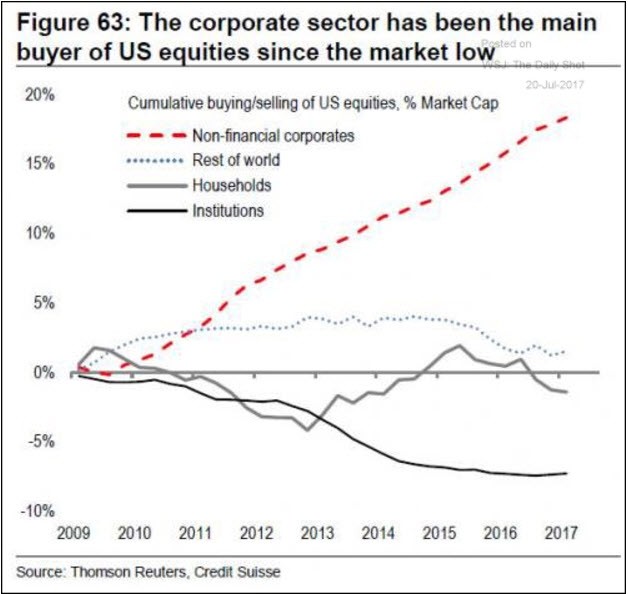
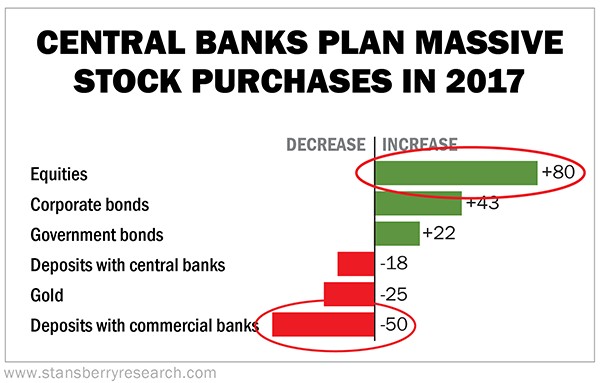
Meanwhile, corporations and central banks have been the main buyers of US equities since the market low as shown in the two charts below:

Figure 63: The corporate sector has been the main  buyer of US equities since the market low  Cumulative buying/selling of US equities. % Market Cap  — Non-finanaal corporates  15%  10%  Rest of world  2009 2010 2011 2012  Source: Reuters. Üedjt  2013  2014  2015  2016  2017


CENTRAL BANKS PLAN MASSIVE  STOCK PURCHASES IN 2017  Equities  Corporate bonds  Government bonds  Deposits with central banks  Gold  Deposits with commercial ban  www.stansberryresearch.com  DECREASE IN  +80  +22  -18  -25  -50

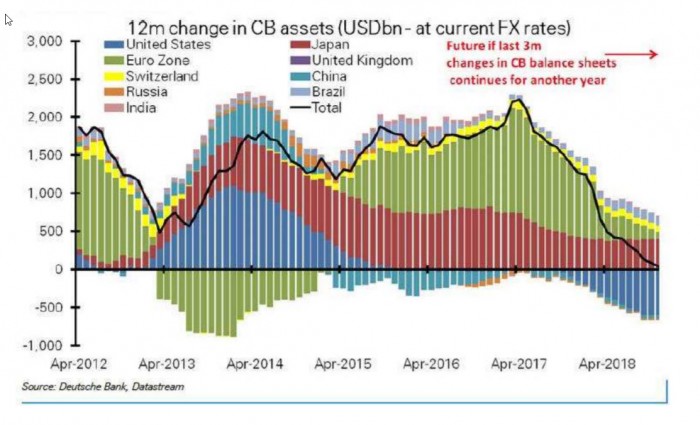
Now what happens as the QE unwinding process steepens thus pushing the monetary base lower? Notice in the figure below how QE-flow peaked in the spring of this year with the European Central Bank, Bank of Japan, and Bank of England continued to print at record levels while the US Federal Reserve continued to taper. Balance sheet reduction will accelerate when the ECB reduces its levels of QE to $30 billion/mo down from $60 billion/mo starting in January 2018. Perhaps that will be the final blow?

12m change in CB assets (USDbn- at current PX rates)  3, 000  United States  Euro Zone  Switzerland  2. soo  Russia  India  2.000  1.500  ii  —Japan  •United Kingdom  —China  a—Brazil  —Total  Future if last 3m  changes in CB balance sheets  continues for another year  1,000  500  -500  -1 , 000  Apr-2012  1  Apr-2013  Apr-2014  Apr-2015  Apr-201€  Apr-2017  Apr-2C18  Samce Lkutsche Lhtastream

Of course, central banks will not continue to reduce QE at this pace should stock markets start to crack as they presented with 20% corrections in 2010 and 2011 which spurred on renewed measures of QE. Singularly, Fed Chair Yellen as well as other major central banks have left open the possibility of lowering interest rates once again, and even going negative (!) should the global economy falter in the face of The Great Unwind. But that in and of itself could spur a crash of some magnitude as markets know central banks have little to no fuel in their respective tanks as interest rates remain at or near historically low levels. Such actions could destroy any remaining faith markets have in the Federal Reserve. 

Like what you read?
Let us help you make sense of these markets by signing up for our free Market Lab Reports:
This information is provided by MoKa Investors, LLC DBA Virtue of Selfish Investing (VoSI) is issued solely for informational purposes and does not constitute an offer to sell or a solicitation of an offer to buy securities. Information contained herein is based on sources which we believe to be reliable but is not guaranteed by us as being accurate and does not purport to be a complete statement or summary of available data. VoSI reports are intended to alert VoSI members to technical developments in certain securities that may or may not be actionable, only, and are not intended as recommendations. Past performance is not a guarantee, nor is it necessarily indicative, of future results. Opinions expressed herein are statements of our judgment as of the publication date and are subject to change without notice. Entities including but not limited to VoSI, its members, officers, directors, employees, customers, agents, and affiliates may have a position, long or short, in the securities referred to herein, and/or other related securities, and may increase or decrease such position or take a contra position. Additional information is available upon written request. This publication is for clients of Virtue of Selfish Investing. Reproduction without written permission is strictly prohibited and will be prosecuted to the full extent of the law. ©2024 MoKa Investors, LLC DBA Virtue of Selfish Investing. All rights reserved.
FOR OUR FREE MARKET LAB REPORT :
Copyright ©2024 MoKa Investors, LLC DBA Virtue of Selfish Investing.
All Rights Reserved.
privacy policy