
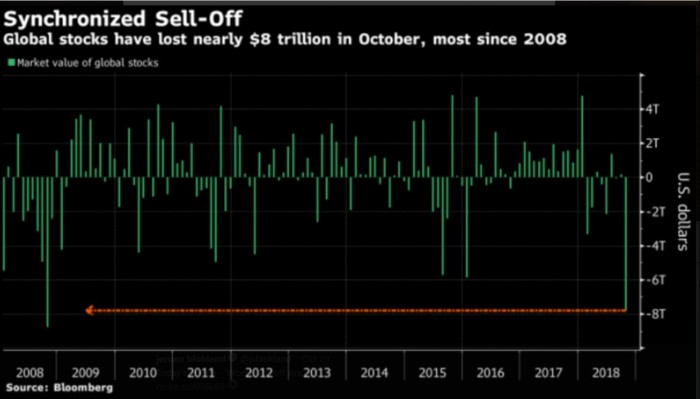
Global stocks lost nearly $8 trillion in October, the most since late 2008, the year of the financial meltdown.
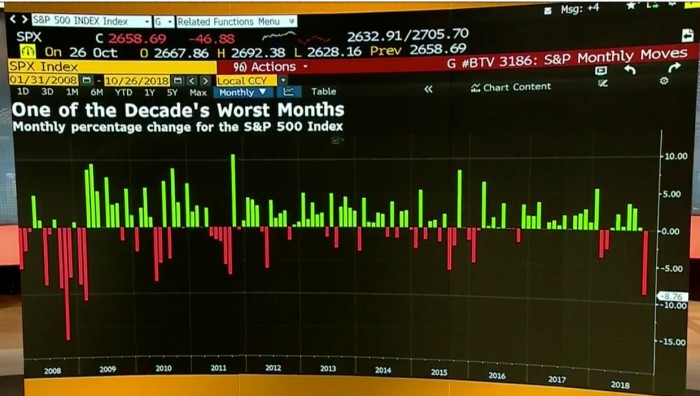
Meanwhile, the S&P 500 lost the most in the month of October, its worst monthly performance since 2009:
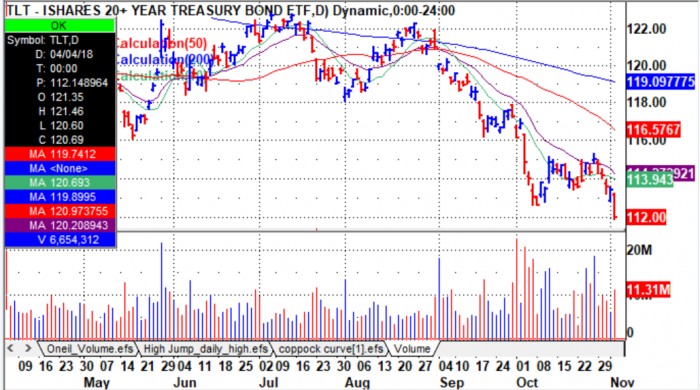
Part of the explanation is that China is reducing their U.S. bond and stock holdings as a retaliatory measure against the U.S. due to the ongoing trade issues. As a whole, foreign buyers now hold just 41% of outstanding Treasury debt, a 15 year low. The reduction in foreign owned debt partially accounts for the selloff in bonds, sending bond yields to multi-year highs. The higher yield, in turn, makes bonds more attractive relative to stocks thus can bleed money out of the stock market. But this pullback in foreign debt also suggests reduced confidence in the U.S. dollar. A major issue has been the U.S. budget deficit, which is at its worst level in six years. Bond prices should continue to fall, thus yields rise as the U.S. government issues more bonds while the Fed decreases its pace of bond buying. Indeed, the 20-year treasury bond ETF TLT is plumbing new lows:
While the yield on the 10-year note is approaching new highs:
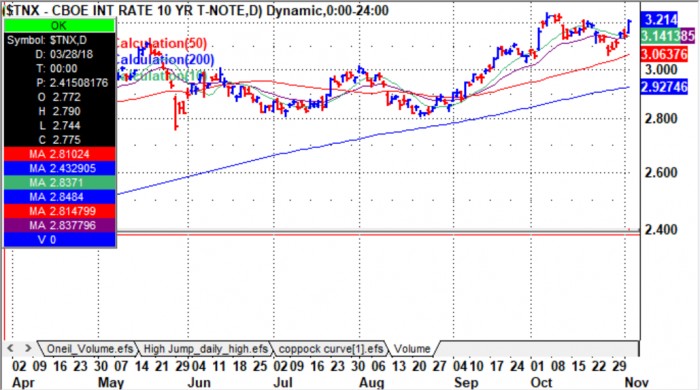
According to Mark McCormick, North American head of foreign exchange strategy at TD Securities, “Yields are rising to reflect a risk premium, rather than healthy growth. People are concerned about how reliable a store of value the dollar is right now.”
Meanwhile, nearly half of U.S. stocks were more than 20% from their 52-week highs at the general market's recent lows. This is approaching levels not seen since the short but very sharp correction in August 2015 when the VIX spiked to 53.29, a level not seen since 2008.
Despite all of this, the jobs report came in strong showing unemployment down to 3.7%, the lowest rate since 1969, while wages rose at the fastest pace in 9 years. The increase in pay over the past 12 months climbed to 3.1% from 2.8%, touching 3% for the first time since the end of the Great Recession in mid-2009.
CPI Distortions
While President Donald Trump continues to paint a rosy picture with regard to the U.S. economy which is nevertheless improving above and beyond that of the global economy as a whole, the GDP numbers remain in question. The CPI has been heavily manipulated numerous times thus today, gives a much lower reading. This has two benefits. First, the U.S. government spends far less on benefits such as Social Security, food stamps, military retirees, and school children on food programs. Second, it increases the GDP:CPI ratio. If CPI exceeds GDP, one could argue the economy is contracting. Keeping the CPI as small as possible makes GDP growth look better than it is in reality.
Over the past 30 years the government has changed the way it calculated the CPI 20 times. As Gil was saying last week, if you calculated the CPI the way the government did in 1990 it would be near 6%, if you calculated it the way the government did in 1980 it would be near 10%. This may explain in part why 75% of Americans dont have even $1000 in savings. The situation is just as bad in the U.K. Trump and Brexit are two signs the majority wants change even if it comes at great risk.
Also calling into question inflation data, the Fed’s unprecedented bond buying program, Quantitative Easing, created $116 million an hour for the entire year in 2013. Yet the Bureau of Labor Statistics said inflation was only 1.5% in 2013, while at the same time, monetary inflation grew 4.9%. Something is off here.
Further, if a good is purchased less frequently due to a rising price, it is removed from the basket of goods used to calculate the CPI. So if prices rise and consumers switch to cheaper products, the CPI formula is biased against goods that rise in price, thus explains in part how the CPI was considerably higher in 1980 and 1990.
Stocks are attempting to bounce, though the question is, after such a massive attack with the S&P 500 sitting with monthly losses not seen since 2009, is the bounce more likely to roll over and plumb new lows? This would occur if something material has changed such as rising yields and the anticipation of less QE over the next year. Otherwise, it could just be representative of money leaving stocks due to higher yields.
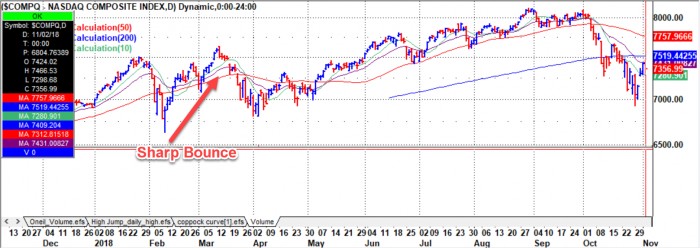
Should Trump's policies continue to take effect, this suggests U.S. stocks will manage to move higher over time, even if in a sloppy manner even as the rest of the world moves toward reducing QE. Look at what happened early this year after the first market correction in February. The market bounced sharply higher.
Nevertheless, at the moment, the number of stocks with chart formations looking constructive still are few. Should the market roll over, continue to watch for those stocks that had sharp bounces off lows up into logical areas of resistance as a short-sale set up. Such shorts carry lower risk since you can keep losses to a minimum knowing your exit point. But should the bounce continue, undercut and rally however is the go-to signature for potential entry points in choppy markets as well as pocket pivots that are not extended. If extended, wait for a constructive pullback which reduces your entry point risk. And once things settle down, volume dry up patterns (voodoo patterns) work well.