
Rising yields
Markets are being sold three stories at once: that rising U.S. yields mean capital is fleeing U.S. assets, that higher rates are automatically bearish, and that Treasury and Fed operations are stealth yield-curve control. None of those three is required by the data.
Higher yields are first and foremost the price of a stronger nominal economy. Growth is paying more for money. That is not the same thing as a confidence crash, and it is not the same thing as the Fed pinning the curve.
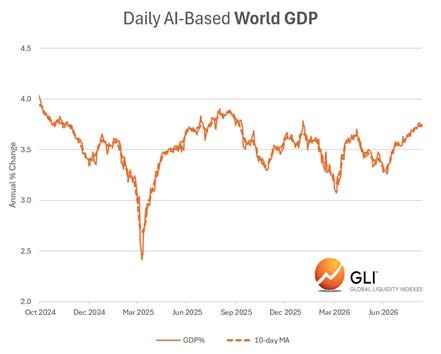
The first check is simple. Is global activity running hot enough to justify the move in yields? Daily world-GDP estimates say yes: the growth tempo is already high, and it is still rising. That is the tape the bond market is discounting.
Nevertheless, one hike is possible, but a hiking cycle is not due to onerous debt. The Fed can hike the short end while buying the long end to keep long bond rates at bay. Full QE is later; for now, not-QE. Liquidity remains a tailwind.
The chart below uses daily World GDP estimates to show that the current growth tempo is both high and still rising. It is not just AI companies (mistakenly mentioned as such) but broad based.
Tech today vs dot coms
Prices can go higher from here because earnings have been running faster than prices, not because a story is being sold with no profits. That is the main difference from 1999–2000.
Nvidia, Microsoft, Alphabet, Meta, Amazon, and now memory/hardware names print large free cash flow. Pets.com did not. Cisco at the dot com peak was a real company on a fantasy multiple; many of today’s leaders are paying for data centers out of operations, not junk bonds.
Hyperscalers have guided on the order of ~$750bn in 2026 and talk of ~$1tn in 2027. That money shows up as revenue at companies such as TSMC, memory, power, and construction. Amazon raising capex because memory is expensive is the opposite of “we’ll buy clicks later.”
In other words, that spending does not stay inside Microsoft’s and Amazon’s income statements. It is paid out as revenue across a chain of suppliers: foundries (TSMC and peers), memory and storage makers, chip-equipment firms, power and grid contractors, and the groups pouring concrete and fitting out data centers. One buyer’s capex line is many other companies’ sales.
Multiples have not exploded the way prices have. Fidelity’s Timmer: S&P tech trailing P/E up, but forward P/E roughly flat to down (about 21x) because earnings jumped — semis’ earnings roughly tripled, so the P/E fell toward ~20x. In 1998–2000 tech trailing P/E went 38 → 71 and forward 26 → 59. That is a different movie.
Goldman also says profits at highs, current account not blowing out the 1990s way, and corporate books still funding most of the spend. Tech is not the most levered sector. Telecom in 1999–2001 spent more than 100–200% of operating cash flow. Even a heavy AI capex year is still well below that telecom ratio.
That said, spend is concentrated in a handful of buyers. If ROI on GPUs and memory disappoints, capex is cut and the hardware earnings mean-revert. That is how every capex boom dies.
Also, CAPE is the S&P 500 price divided by the 10-year average of inflation-adjusted earnings which is historically high. But recursivity matters and means AI is not a one-shot cost cut. Models help design better models, software writes software, capex today raises the earnings in the 10-year window CAPE uses. If trend real earnings growth stays up, the same price/earnings ratio can coexist with a higher justified price level—or, equivalently, a higher equilibrium CAPE—because the denominator’s future path is steeper than history.
PEs dropping
**Stocks went up. They also got cheaper.**
Labor Day’s over. Inflation, Oracle, Fed chatter this week. None of it overrides the actual driver: earnings have run so hard that U.S. and global equities are cheaper than January while prices are higher.
S&P 500 Q2 EPS +50.7% after +19% in Q1. Ex-mark-to-market, still +25%. Forward EPS just hit a record $401.75 through Iran, energy, Fed fog, and midterms.
Ed Yardeni already has the Street’s highest year-end target at 8,400 and said Sunday he may raise it.
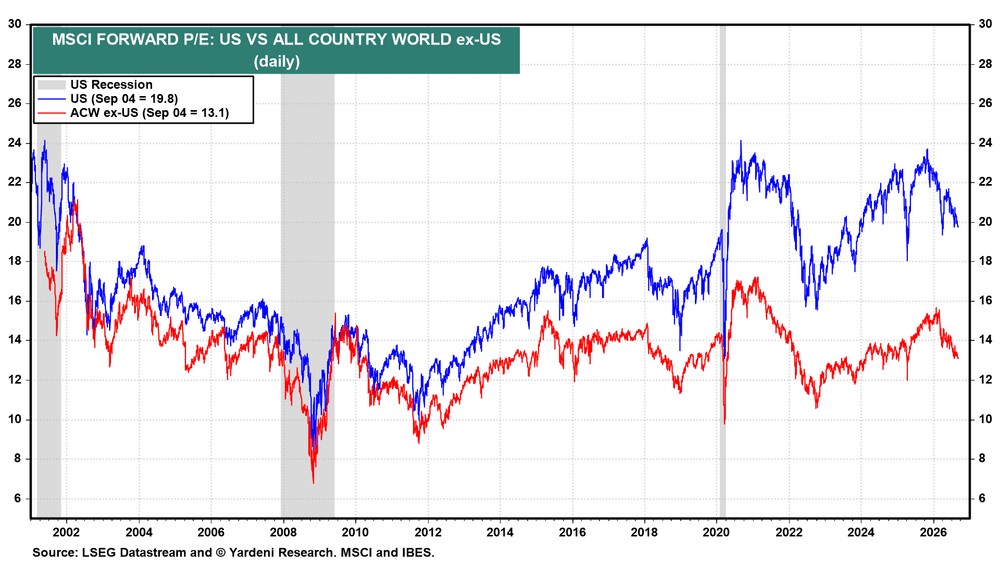
Forward P/E is down ~12% since January. The index is up ~13%. That is earnings carrying the tape, not a multiple blowoff.
Same math globally. MSCI ACWI ex-US at 13.1x forward vs. 19.8x for the U.S. Both multiples have fallen hard since January. Owning abroad no longer requires a different religion from owning the S&P.
Price can rise and still get cheaper. That’s the setup.
Keep stops. Size for volatility. Liquidity underwrites the cycle. Earnings are justifying the ride.
|
That said, when tech rolled over, capital switched to broad based indices such as NYSE Composite. But now that it, too, is rolling over showing many non-tech names getting hit, capital is switching back into tech such as SOX index.
Given that the Fed was at $2 bil/mo then $4 bil/mo then potentially $8 bil/mo in the massive scale-up of its nominal long-end liquidity support buyback operations, as well as other central banks that continue to print, the Fed put is alive and well to keep long bond yields manageable which should also support major stock market averages overall.