
Market Lab Report / Dr. K's Crypto-Corner
by Dr. Chris Kacher
The (R)Evolution Will Not Be Centralized™
Stock and Crypto Markets - Timing is Everything
On Dec 14, 2021, we started to make major bearish calls on both stock and crypto markets then removed most names from the crypto picks list in Dec-2021 and Jan-2022 taking massive profits in some cases. Since then, nearly all major crypto commentators with huge followings have found 101 reasons why we are still in a crypto bull market. Arguments range from record low supply of both BTC and ETH to record levels of coins being removed from major exchanges to numerous on- and off-chain metrics arguments. It's been feeling like 2018 all over again except the BTC metrics then were poor. One thing in common throughout all the major crypto bear markets have been a hawkish Fed. I demonstrated this by comparing the history of QE vs. the NASDAQ Composite Index in a recent piece. The stock market showed it could at times buck a hawkish Fed, and even the crypto markets were able to overcome tightening in 2017 as ethereum and altcoins had massive runs.
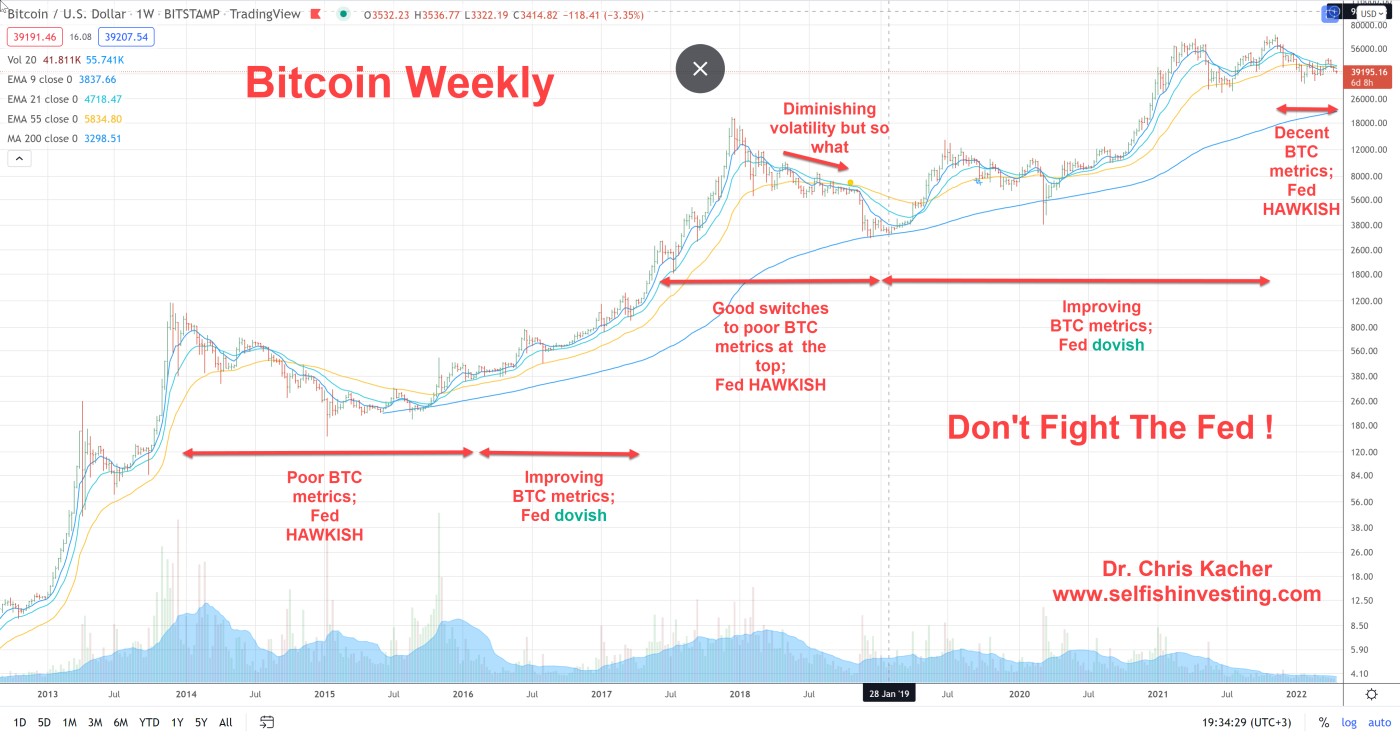
Here is a chart showing how the price of bitcoin is generally far more sensitive to a hawkish Fed. It is a weekly chart to give a broader bird’s eye view. The rallies seen in 2018 were large on an absolute basis but small on a relative basis. Bitcoin rallied 46% from Jun to Jul 2018, but on the chart, it looks like a tiny blip. Commentators declared the bitcoin bull is back each time it rallied in 2018. As can be observed, most all who tried to time these rallies in 2018 lost money since the rallies were sharp and short-lived. Volatility then dried up in Sep to Oct spurring many to assume it is onward and upward in bitcoin price from here. The same could happen today where it’s not uncommon for bitcoin or ethereum to rally over 30% before continuing their downtrends. This goes thrice for altcoins which are far more volatile.
There are two aberrations in the chart where crypto tanked despite a dovish Fed. The first was the black swan in Mar-2020 due to C19, and the second occurred in stages between April and May 2021. On April 16, nine thousand bitcoin were sent to the Binance exchange by a whale to unload. This selling pressure together with selling in BTC futures pushed bitcoin below liquidation levels of $59k which caused a cascade of liquidations down to 50800. Then on April 18, 2021, a blackout in Xinjiang caused the hash rate of bitcoin to collapse. The combined selling pressures was sufficient to trigger a cascade of automatic sell-offs in a chain reaction. $4.9b in BTC contracts were liquidated which rose to $9.3b when including alt-coin markets. Then the futures markets became overheated again in May 2021 which caused a cascade of selling liquidations which froze a number of major crypto exchanges.
Nevertheless, the lesson of "Don't fight the fed" rings even more true for cryptocurrencies than stocks. Still, many cling to bullish arguments that volatility is diminishing or that bearish market sentiment is at an extreme, yet one can see similar occurred in 2018 before the ruthless downtrend continued in vicious delight. Other arguments are that retail and longer term HODLers continue to buy the dip while on-chain fundamentals continue to strengthen. This was stated as early as Nov-2021 when bitcoin was above $60k and has been repeated since a number of times. Bitcoin has lost -42% off its peak price at the time of this report. Altcoins have fared far worse.
Then there are the 50,000-foot view arguments that cryptocurrencies are massively transformational to wit DAOs, DApps, DeFi, NFTs, and the metaverse will be worth tens of trillions over the next several years as digital eats the world. I couldn't agree more. But properly timing the market is everything. Cryptocurrencies have lost 85-99.9% during major bear markets. 2018 was brutal for most traders, investors, and HODLers. Meanwhile, I was up double digit percentages in 2018 without shorting and just taking profits in mid and late Jan-2018 as the audit shows. I then sat mostly in cash the rest of the year, avoiding the massive bloodshed that ensued.
My bitcoin metrics together with a hawkish Fed had pushed me mostly into the safety of cash. I then got a major bitcoin buy signal in Mar-2019, more than a year later. But today's soaring double digit global inflation thus quickly debasing fiat leads people to think being in bitcoin is a safer bet. While this holds true over the long run, bitcoin has been known to correct well beyond -80% during bear markets. In fact, it corrected -84% and -87% during its last two bear markets and -94% not once but twice before that! So while bitcoin is a better bet than plummeting currencies, more stable currencies such as the dollar, euro, and pound can be a good place to park capital during major crypto corrections. And of course, should we get a white swan event pushing bitcoin higher, I would naturally switch as well as I am never wedded to either side of the market. Powell crying "Uncle!" would be a major buy signal but given soaring inflation, he has no choice but to hike rates. The Fed's Bullard is now pushing for a 75 bps rate hike in May.
The rule of percentages to get back to breakeven
Given all this talk about deep corrections exceeding -75%, it's important to remember how percentages work in terms of getting back to breakeven. If your account loses -50% of its value, you need a 2x or 100% gain to get back to breakeven. If your account loses -80% of its value, you need a 5x or 400% gain to get back to breakeven. And if your account loses -95% of its value, you need a 20x or 1900% gain (!) to get back to breakeven. So the difference between a drawdown of -80% and -95% is NOT just 15%, but a whopping 300% in terms of equalizing an -80% and -95% loss since your dollar would have turned into 0.20 and 0.05 cents.