
by Dr. Chris Kacher
We advise members to keep a close eye on actionable entry points that work vs those that fail, along with stocks hitting their sell stops. It has always been a good way to manage risk. The weaker markets get, the lower (or zero) exposure you have to the market. The stronger markets get, the greater your exposure. Trending markets and stocks allow one to enjoy gains while steering clear of sideways to down markets which typically trigger stops.
Global central banks
The ECB hiked rates by 25 basis points for the first time since 2023. The main trigger was higher energy prices from the Iran conflict, which pushed inflation back up. Some are concerned that since central banks tend to move together, this will start a tightening cycle. But governments have so much debt that they cannot easily afford significantly higher rates for long. This creates pressure for central banks to eventually ease again or find ways to keep liquidity flowing, even if inflation is sticky.
Liquidity can overcome moderately higher rates if it expands strongly enough. We’ve seen this dynamic before (especially 2020–2021 and parts of 2023). Excess money creation tends to dominate asset prices more than moderate rate changes, because it directly increases the amount of capital chasing investments.
However, there are limits:
- If rates keep rising (e.g. another 50–75 bps), it can temporarily overpower liquidity effects and pressure markets.
- The bigger driver will be whether central banks eventually restart or expand liquidity measures to help governments manage their debt.
Fed's dot plot + testimony
The Fed's dot plot showed one more rate hike late in the year in line with CME FedWatch. However, while 9 of the 18 officials see one hike this year, 5 see two hikes, and 1 sees three hikes. This is mildly hawkish overall. Markets reacted somewhat negatively to this 2 pm ET data release. But during the testimony, markets bounced as Warsh said dot plot submissions came in with pencils with big erasers and stressed policymakers do not feel bound by their dots. Warsh came across as more dovish than the hawkish dot plot suggested. But the dot plot still carries weight so markets reacted more to the collective hawkish shift in the dot plot (new dot plot: 1 hike this year vs. former dot plot: 1 cut this year) than to Warsh’s individual tone. Investors repriced from “cuts are coming” to “rates could stay higher for longer than expected.” Nevertheless, pre-market futures were up on geopolitical relief (Iran) and a slightly less hawkish-than-feared message from the Fed.
Record debt
As for record debt, the US Treasury must roll over and finance a massive and rapidly growing stock of gross debt at a time when the financial system’s ability to absorb that supply is both cyclical and deteriorating. Gross Treasury issuance scheduled for 2026 is on track to approach $25 trillion — roughly $480–500 billion per week. That is not a marginal increase in supply. It is a structural shift in the volume of debt the market must continuously digest.
This creates a recurring mismatch between debt supply and available liquidity. When liquidity is abundant, the system can paper over the imbalance. When it isn’t, the pressure shows up in higher term premia, wider spreads, and more volatile auctions. Central banks are then left with an uncomfortable choice: inject more liquidity to keep the debt machine running, or risk a disorderly tightening that feeds back into higher borrowing costs and larger deficits. The first option risks inflating asset bubbles and re-igniting inflation pressures. The second makes the fiscal math worse, raising debt-servicing costs and increasing the odds of a self-reinforcing deterioration in the debt-to-liquidity ratio.
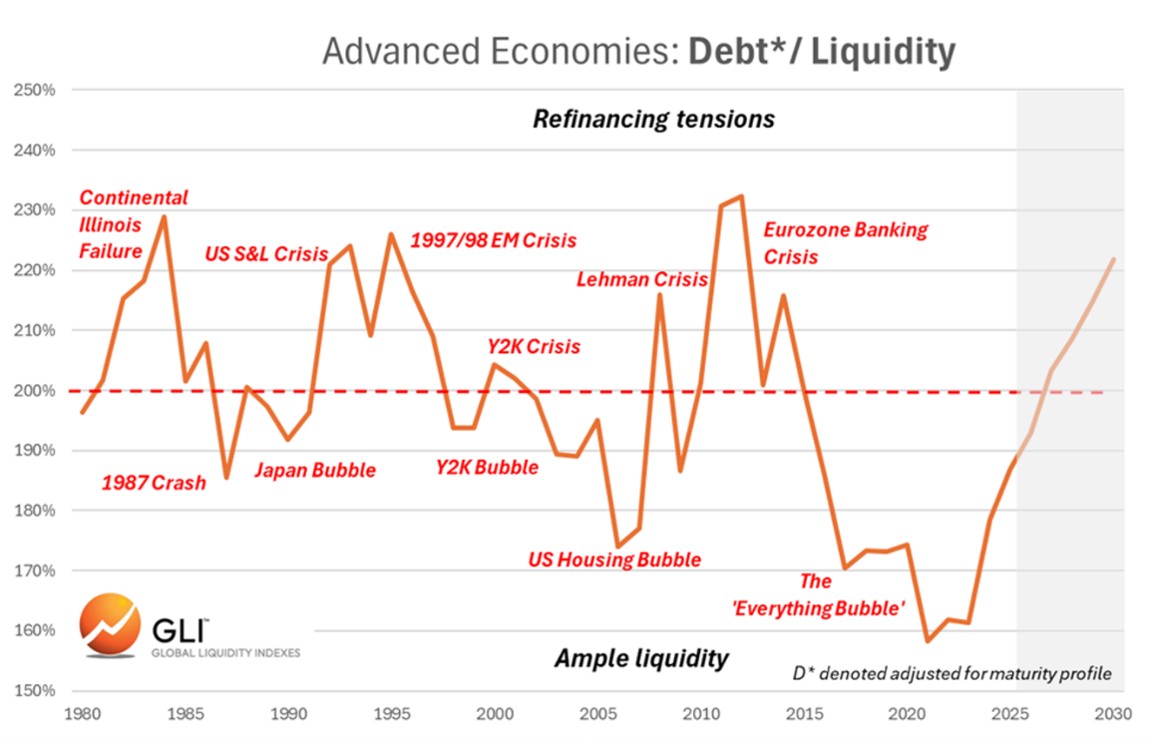
That tension sits at the heart of the modern financial cycle. Historically, moves in the average debt/liquidity ratio across advanced economies have been a reasonably reliable signal. Readings well above the long-term median have usually preceded periods of stress and crisis. Readings well below it have more often coincided with the buildup of asset bubbles. The pattern is not random. Crises tend to emerge when the system shifts from a regime of abundant liquidity into one dominated by excessive debt. After the “everything bubble,” the risk is an “everything bust” once liquidity conditions turn.
The deeper paradox is that debt and liquidity are mutually dependent. Debt needs liquidity to be refinanced at reasonable cost. Liquidity, in turn, relies on the existence of large quantities of high-quality, stable debt that can serve as collateral in repo markets and other funding channels. When either side weakens, policymakers are forced to intervene on both. The Treasury has already moved in this direction through increased bill issuance and occasional buybacks aimed at supporting collateral and market functioning. The Fed, for its part, continues to backstop repo-market liquidity. These are not neutral technical adjustments. They are admissions that the private market’s balance-sheet capacity is no longer sufficient on its own to absorb the scale of public debt being created.
Over the longer term, however, there is a potential structural offset that could ease this tension: **AI-driven supply-side deflation**. If artificial intelligence delivers meaningful productivity gains across the economy, it could increase the supply of goods and services faster than demand, exerting downward pressure on prices. This is not demand destruction — it is genuine supply expansion. In theory, this would allow real economic growth to run hotter without generating the same inflationary pressures that have historically forced central banks to tighten aggressively. Stronger real growth would also improve the debt-to-GDP trajectory, making the existing stock of debt more sustainable without requiring either much higher taxes or sustained monetary accommodation.
What makes AI different from previous technological breakthroughs is its **recursive nature**. Unlike electricity or the internet, which improved productivity primarily through one-time infrastructure buildouts and gradual adoption, AI can be used to improve itself. Better models can design better training systems, write better code, optimize their own architectures, and accelerate scientific discovery. This creates the potential for compounding progress at a much faster rate than historical technologies allowed. The feedback loop between capability and improvement could compress what previously took decades into a shorter window.
That said, the critical question remains **timing**. Even with recursive improvement, translating AI capabilities into broad-based, measurable productivity gains across the real economy still faces significant frictions — integration into legacy systems, regulatory hurdles, energy constraints, and the time required for businesses to reorganize around new tools. Historical parallels suggest that even powerful general-purpose technologies take time to show up in aggregate productivity statistics. While AI’s self-improving nature raises the possibility that disinflationary effects could arrive within the next couple of years, it does not guarantee they will arrive soon enough to materially ease the current debt and liquidity pressures over the next few years.
In the meantime, the system remains vulnerable to shifts in risk appetite or funding stress. Policymakers can manage the symptoms through liquidity support and careful debt management, but they cannot eliminate the underlying imbalance between the scale of debt issuance and the private sector’s willingness and capacity to absorb it. AI may eventually help resolve the tension from the supply side, and its recursive character makes that outcome more plausible on a faster timeline than past technologies, but over the shorter run, debt/liquidity dynamics are unlikely to be resolved by technological progress alone so expect some speed bumps ahead.