
The VoSI VooDoo Report
Offbeat Ideas and Commentary from the Depths of Gil’s Trading Notes
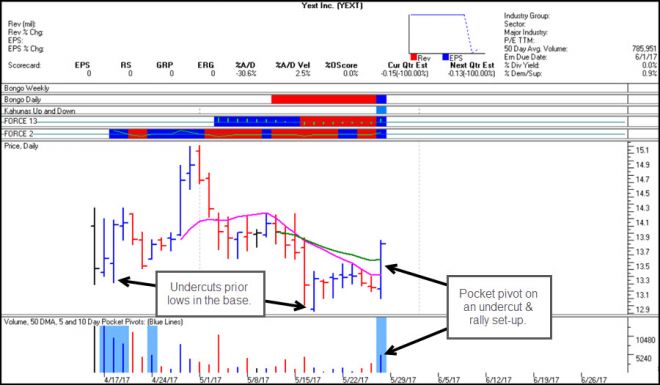
For those of you who subscribe to and attend our weekly live, intraday webinar service, you witnessed a real-time example of an IPO “Ugly Duckling” long set-up that I discussed during the webinar on Friday. Yext (YEXT), which came public back on was just starting to move above a prior 13.19 in the pattern in real-time that morning. The stock was edging just above the 13.20 price level at the time, and I noted that it was a buyable undercut & rally (U&R) long set-up right then and there.
After the live webinar had concluded at 10 a.m. PST, YEXT spent the next two hours hovering around the 13.20 price level. Then, as we moved into the final hour of trading on Friday, it began to move to the upside, reaching a peak of 13.80 before settling in to close at 13.75. In the process, it posted a bottom-fishing or roundabout type of pocket pivot on a strong volume increase.
This now becomes buyable using the 10-dma at 13.33 or the 20-dema at 13.56 as tight selling guides. Keep in mind that YEXT is expected to report earnings on Thursday after the close, so you’d like to see some an additional upside in the stock before then. Otherwise, I’ll be very interested to see what this does after earnings.
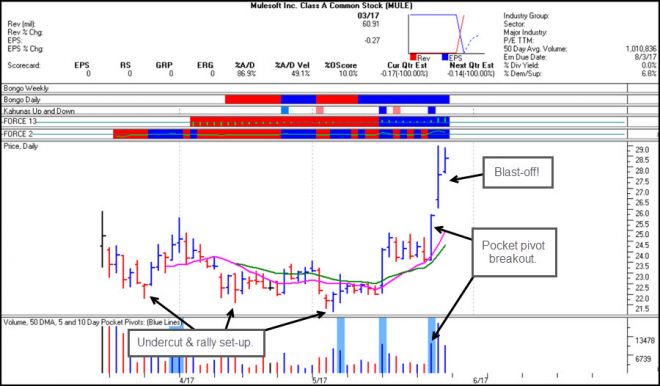
This is a typical Ugly Duckling set-up that I look for in recent IPOs. I keep a watch list of recent IPOs, and I am on the lookout for any of these names setting up along the lows of potential new bases. One example from previous VooDoo Reports (May 21st and April 23rd) is MuleSoft (MULE). As I noted last week, MULE had finally pulled off an undercut & rally move on the second attempt, illustrating why one must be persistent in monitoring these set-ups.
Sometimes the first U&R doesn’t work, but a later U&R in the pattern does. That was the case with MULE, and if you were alert to the test of the 10-dma on Tuesday of this past week followed by a strong-volume pocket pivot breakout on Wednesday, you could have jumped on board for a nice rocket ride over the next two days. Of course, you must be alert to this in real-time and ready to move when the time was right. Investors that lack the resourcefulness to see this and assess it properly in real-time generally don’t have what it takes to capitalize on this sort of thing.
So, persistence, alertness, and resourcefulness are all critical characteristics of investors who can profit from these types of unlikely Ugly Duckling IPO set-ups. In this spirit, I continue to monitor a name like Smart Sand (SND) as it continues to move lower in its pattern. As a fracking-sand supplier and therefore an oil-related name, SND probably has a better chance at pulling off some sort of true U&R move IF and only IF the oil group as a whole finds a bottom and the individual oil-related names begin to work up the right sides of potential new bases.
The prior two undercut & rally attempts in SND failed rather quickly, and of course when that happens the prior low is used as a quick downside stop. That is the beauty of the U&R set-up, as a move up through a prior low in the pattern serves not only as a trigger point for executing the long trade, but also as a tight selling guide. The closer to the trigger point one enters the trade, the lower the risk, and the easier it is to give the trade an extra 1-2% below the trigger point as a selling guide to account for downside “porosity.”
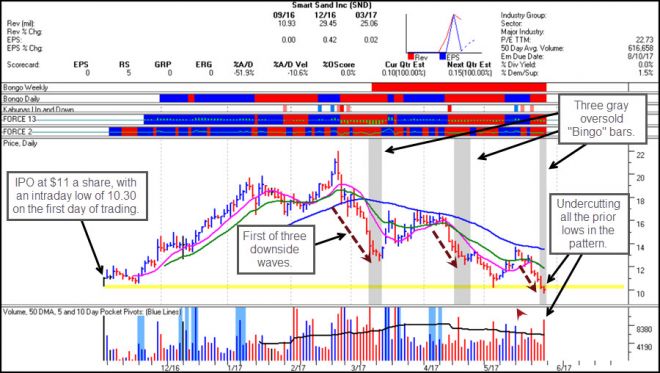
At this point, SND is looking so damn ugly that no sane person would even bother with this piece of junk. But there are some interesting features on the daily chart that start to crop up at these levels that keep me watchful of the stock. First, note that SND IPO’d back in November 2016 at $11 a share. On the first day of trading it posted a 10.30 intraday low, and then nearly doubled over the next 11 weeks.
SND finally topped in late February after more than doubling from the IPO day, and has since declined in three big downside waves. The end of each of these downside waves was marked by a gray oversold “Bingo” bar on the HGS Investor Software (for more info: www.highgrowthstock.com) daily chart that I show below. When I see three distinct Bingo bars, or three distinct and tight groupings of Bingo bars as a stock moves lower, I begin to get interested in the pattern.
Note also that SND is now below all the prior lows in the pattern extending all the way to the first day of trading and the 10.30 intraday low it posted on that day. Also notice that on Friday SND traded a fair amount of volume, 59% above-average to be precise, yet held in a tight range at the $10 price level. From here I would watch for a move back up through the 10.23 prior low of May 4th as a U&R long trigger.
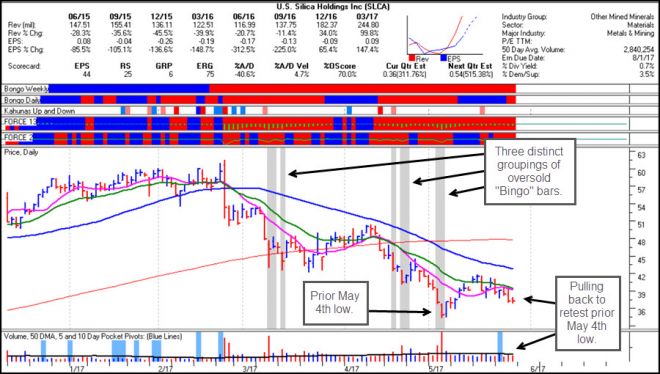
At the same time, I want to keep a close eye on “cousin” stocks, such as Silica Holdings (SLCA), which is currently engaged in what appears to be a Wyckoffian Retest of the prior 34.39 low posted on May 4th. From here I’m watching for some sort of extreme volume dry-up (voodoo action) as the stock approaches the prior low. This would then qualify as a Wyckoffian Retest, and would be confirmed if was followed by some sort of bottom-fishing pocket pivot coming back up through the 10-dma and 20-dema.
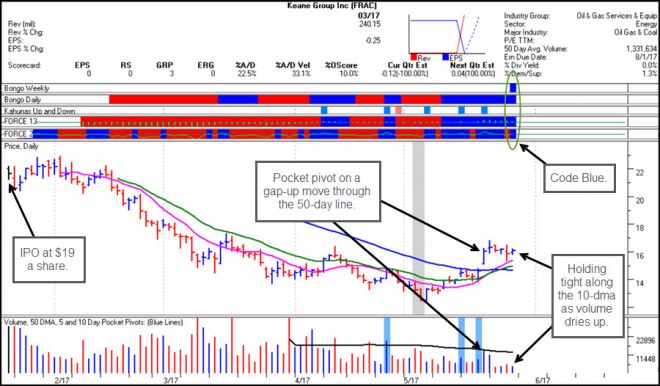
In addition to all this oily stuff that I keep watching as it all sinks lower I note one positive chart in the group. Recent IPO Keane Group (FRAC) is a provider of horizontal and vertical hydraulic fracturing, and other fracking-related engineering solutions and services. If I'm remembering my market history correctly, I believe FRAC is a new iteration of the old KEA, with a greater emphasis on fracking services. Here we can see that FRAC posted a roundabout type of pocket pivot two Fridays ago as it gapped back up through its 50-day moving average.
That pocket pivot is actionable, using the 50-day line as a maximum downside selling guide. However, with the stock holding above the rising 10-dma and 20-dema lines as volume dries up sharply in voodoo fashion (-65% below average on Friday), those can be used as tighter selling guides instead. Perhaps the action in FRAC is a harbinger of better times to come for the oils, the frackers, and the fracking sand names.
On Thursday OPEC extended its output cut agreement for nine more months, but oil stocks didn’t react in any meaningful way. The price of crude oil declined sharply, but stabilized on Friday to close up on the day. The market seems to be casting a vote of no confidence in the agreement simply because the prior agreement failed to decrease global crude oil stockpiles. This is primarily because U.S. producers have come in to pick up the slack. And they do so because the current state of “backwardation,” where spot oil prices are higher than future oil prices and which is considered a “normal” state, works in their favor. They lock in future prices by producing now and putting the oil in storage for the purpose of meeting those future commitments at the higher prices.
Meanwhile, OPEC, the International Energy Agency, and Goldman Sachs (GS) have raised their forecasts for the growth of U.S. production in 2017. As Goldman’s research note indicates, this forecast extends beyond the Permian Basin in Texas to other areas where low-cost production can be carried out. I don’t claim to be an oil expert by any stretch of the imagination. All I really know is what the charts tell me. But the dynamism of the fundamental backdrop has the potential to create opportunities, IF the technicals line up. For this reason these oil-related pieces of garbage remain on my Ugly Duckling watch list.