fb
X
X
Tired?
Unfocused?
Off your game?
Read our free, updated as of Mar 3, 2022, Dr K report on how to optimize your mind and body so you can boost your focus when trading the markets.
YES, SEND ME THE REPORT !
Meet Dr K !
Chris Kacher
  • Nuclear physicist
  • Stock & crypto market wizard
  • Blockchain builder
  • Bestselling author
  • Top 40 charted musician
  • Biohacker
  • Former computer hacker
YES, SEND ME THE FILE !
YES, SEND ME BOTH !
Your email will always remain private.

Market Lab Report - VIX hit all-time lows today. What does this mean for markets?

Ultra-low readings on the VIX tend to be short-lived as markets tend to stage minor corrections to bring the VIX back in line with its trading range. Notice how since 2016, the VIX establishes a trading range for a number of weeks, then establishes a lower trading range sometime later.

Trading Ranges:

Mar '16 - Jun '16 = Roughly 12.5 to 16.5
Jul '16 - Sep '16 = Roughly 11 to 14
Dec '16 - Apr '17 = Roughly 10 to 13
May '17 - Jul '17 = Roughly 9.5 to 11


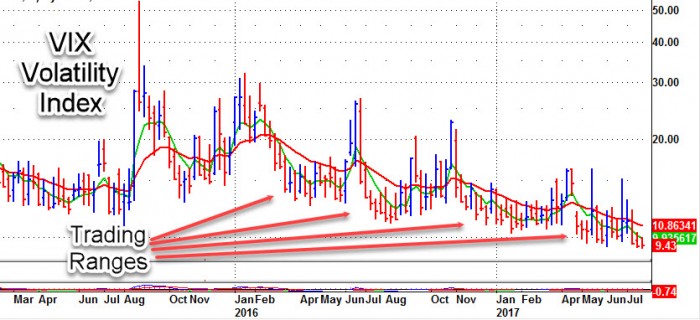
So even though the VIX hit new all-time lows of 9.26 in today's trade, it does not mean a serious correction is near. With quantitative easing (QE) at all-time highs from global central banks, the US stock market is unable to establish any meaningful corrections as it is the direct beneficiary of QE. For example, corporations use QE to buy back stock pushing prices higher and reducing the float, thus artificially boosting earnings.

That said, the US stock market may encounter headwinds in terms of making any real upside progress while the VIX lingers around all-time lows. If history repeats as it has since 2016, the VIX in the coming weeks will establish a lower trading range, perhaps from 8.5 to 10, or equivalent.

In the process of establishing this new lower trading range, the stock market may undergo a minor -3% correction as it has so far this year in March, May, and June of this year. Notice how the VIX has had minor spikes each time. When such minor corrections have occurred, leading stocks tend to fall at least twice or three times as much as the major indices. Thus our continued guidance to keep stops tight and sell when a stock's price gets ahead of itself in context with its chart.

And just as importantly, keep a close eye out for reentering your positions as leading stocks will often undercut prior significant lows, then rebound, offering a low risk reentry point. We call this the Wyckoff undercut & rally pattern and is one of a number of time-tested buy points that have worked very well in this QE-manipulated market. Examples are shown HERE.
Like what you read?
Let us help you make sense of these markets by signing up for our free Market Lab Reports:
This information is provided by MoKa Investors, LLC DBA Virtue of Selfish Investing (VoSI) is issued solely for informational purposes and does not constitute an offer to sell or a solicitation of an offer to buy securities. Information contained herein is based on sources which we believe to be reliable but is not guaranteed by us as being accurate and does not purport to be a complete statement or summary of available data. VoSI reports are intended to alert VoSI members to technical developments in certain securities that may or may not be actionable, only, and are not intended as recommendations. Past performance is not a guarantee, nor is it necessarily indicative, of future results. Opinions expressed herein are statements of our judgment as of the publication date and are subject to change without notice. Entities including but not limited to VoSI, its members, officers, directors, employees, customers, agents, and affiliates may have a position, long or short, in the securities referred to herein, and/or other related securities, and may increase or decrease such position or take a contra position. Additional information is available upon written request. This publication is for clients of Virtue of Selfish Investing. Reproduction without written permission is strictly prohibited and will be prosecuted to the full extent of the law. ©2024 MoKa Investors, LLC DBA Virtue of Selfish Investing. All rights reserved.
FOR OUR FREE MARKET LAB REPORT :
Copyright ©2024 MoKa Investors, LLC DBA Virtue of Selfish Investing.
All Rights Reserved.
privacy policy