
by Dr. Chris Kacher
Volatility predicts Bitcoin
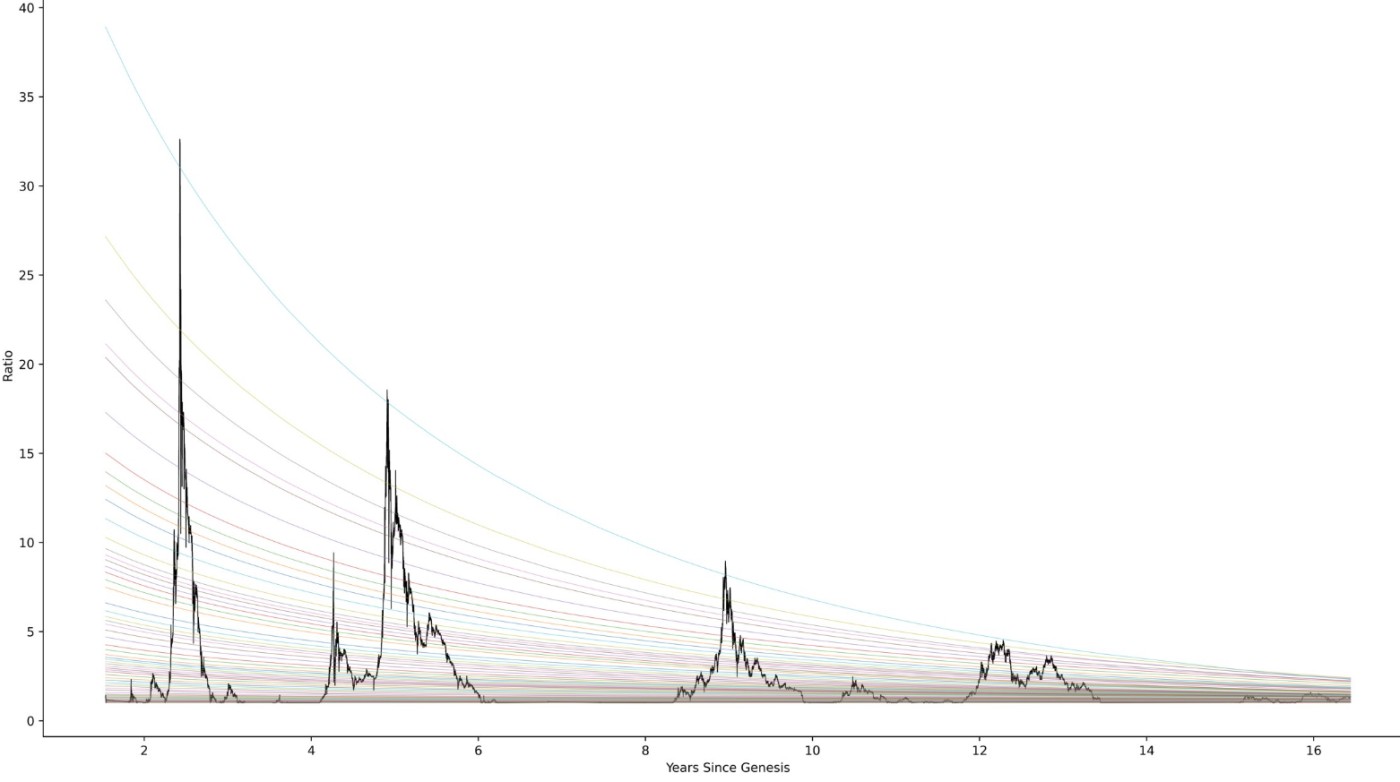
Volatility spikes are predictors of long term price trends in Bitcoin.
https://x.com/therealplanc/status/1932649990117036069?s=51&t=j3pxtoaR8s5Q5FHuZY-FwQ
In many natural systems—like a cooling cup of coffee, relaxing materials, or even fading memories—things don’t lose energy or intensity at a constant rate. Instead, the process slows down over time. For example, a hot object might cool quickly at first, then gradually take longer to lose the remaining heat. This "slowdown" effect is where the stretched exponential function comes into play. So far, Bitcoin follows it nicely. The graph shows how Bitcoin’s price volatility spiked during its climax tops in 2013, 2017, and 2021 with the time of genesis being Jan-2009. It will likely spike again sometime later in 2025 or in early 2026. This implies Bitcoin will have another climax run into potentially hundreds of thousands of dollars during this time.
This animation https://x.com/BitcoinNews21M/status/1935236026215149752 shows how BTC will climax top at $250,000 before the end of the year.
But here's why it may well exceed $250,000:
The April 2024 Bitcoin halving reduced the daily supply of new BTC from miners by 50%, creating a structural shortage. Historically, halvings trigger bull markets 12–18 months later as demand outpaces supply.
With only 2–3 million liquid BTC available on exchanges (per CryptoRank), even modest demand spikes could drive parabolic price action.
Spot Bitcoin ETFs (e.g., BlackRock, Fidelity) have attracted billions in inflows, funneling institutional and retail capital into BTC.
Analysts like Cathie Wood (Ark Invest) and Standard Chartered predict ETF-driven demand could push Bitcoin to $150,000–$1 million as Wall Street adoption accelerates.
The number of Bitcoin users continues to double every 12 months.
Institutions, companies, and governments are making BTC part of their Treasury.
Falling interest rates (expected in 2025) reduce the cost of capital, incentivizing investment in risk assets like Bitcoin.
Central bank liquidity injections (quantitative easing) and a weaker U.S. dollar could further boost Bitcoin’s appeal as a hedge against inflation and currency debasement.
A breakout above $100,000 (Bitcoin’s current all-time high is ~$109,000) could trigger a FOMO-driven retail frenzy, mirroring past cycles. Analysts like Max Keiser and Tom Lee (Fundstrat) suggest this could propel BTC to $500,000 as mainstream media coverage intensifies.
Pro-crypto policies under Donald Trump’s administration (e.g., proposed U.S. Bitcoin reserves, SEC reforms) are reducing regulatory uncertainty.
The FDIC and other agencies are revising guidance to allow banks to engage with crypto, further legitimizing Bitcoin.
Realized capitalization (tracking the value of BTC at their last transaction) has hit consecutive all-time highs, indicating sustained capital inflow.
Long-term holder accumulation and reduced exchange reserves suggest a supply squeeze is imminent.
But remember that all of these pros don't matter if price/volume don't measure up. Technical price action is the ultimate judge.
And here's why it may fail to hit $250,000:
BTC volatility (see first chart above) is diminishing so its climax top may be less than in prior tops.
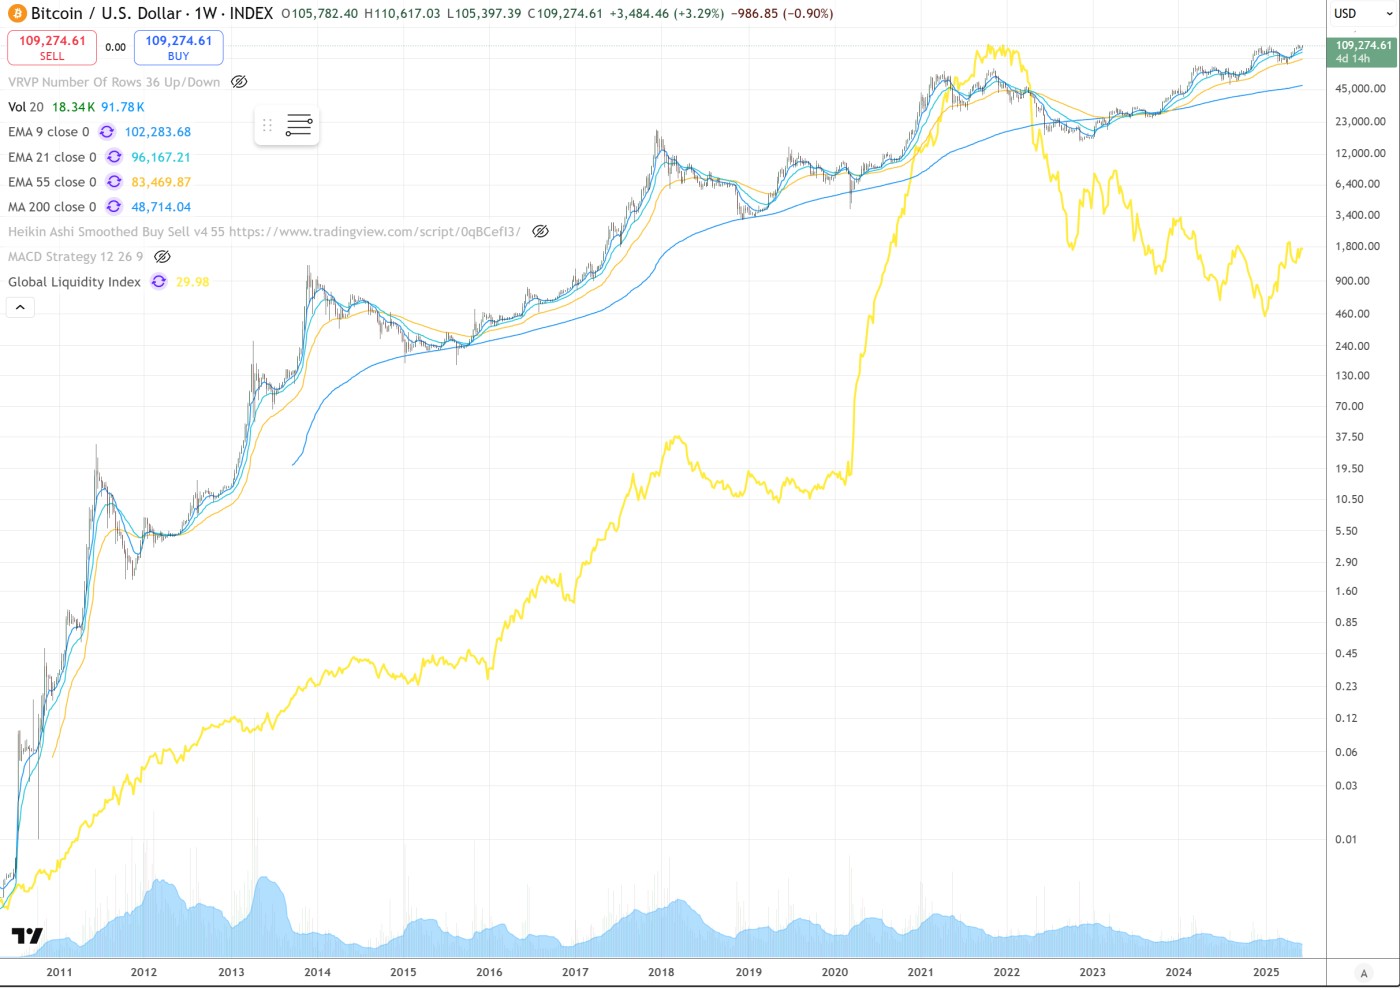
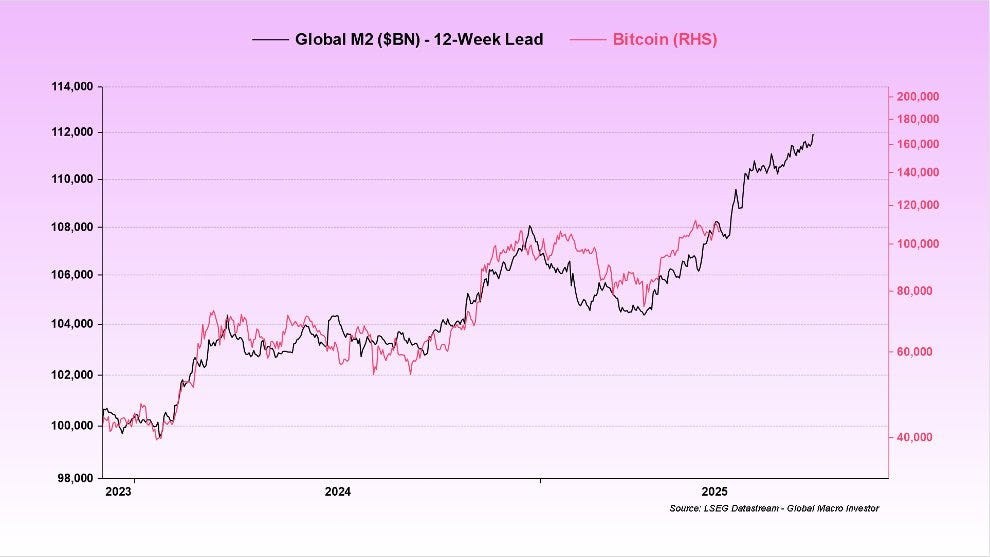
Global M2 predicts the price of Bitcoin. Raoul Pal recently highlighted that “89% of all BTC's price action is explained by global liquidity.” Hoskinson who created Cardano cryptocurrency which remains in the top 15 largest cryptos by valuation is admitting that his altcoin will not be able to hold water compared to Bitcoin over time. The only way to create long-term economic value is to sell his altcoin treasury and purchase bitcoin.
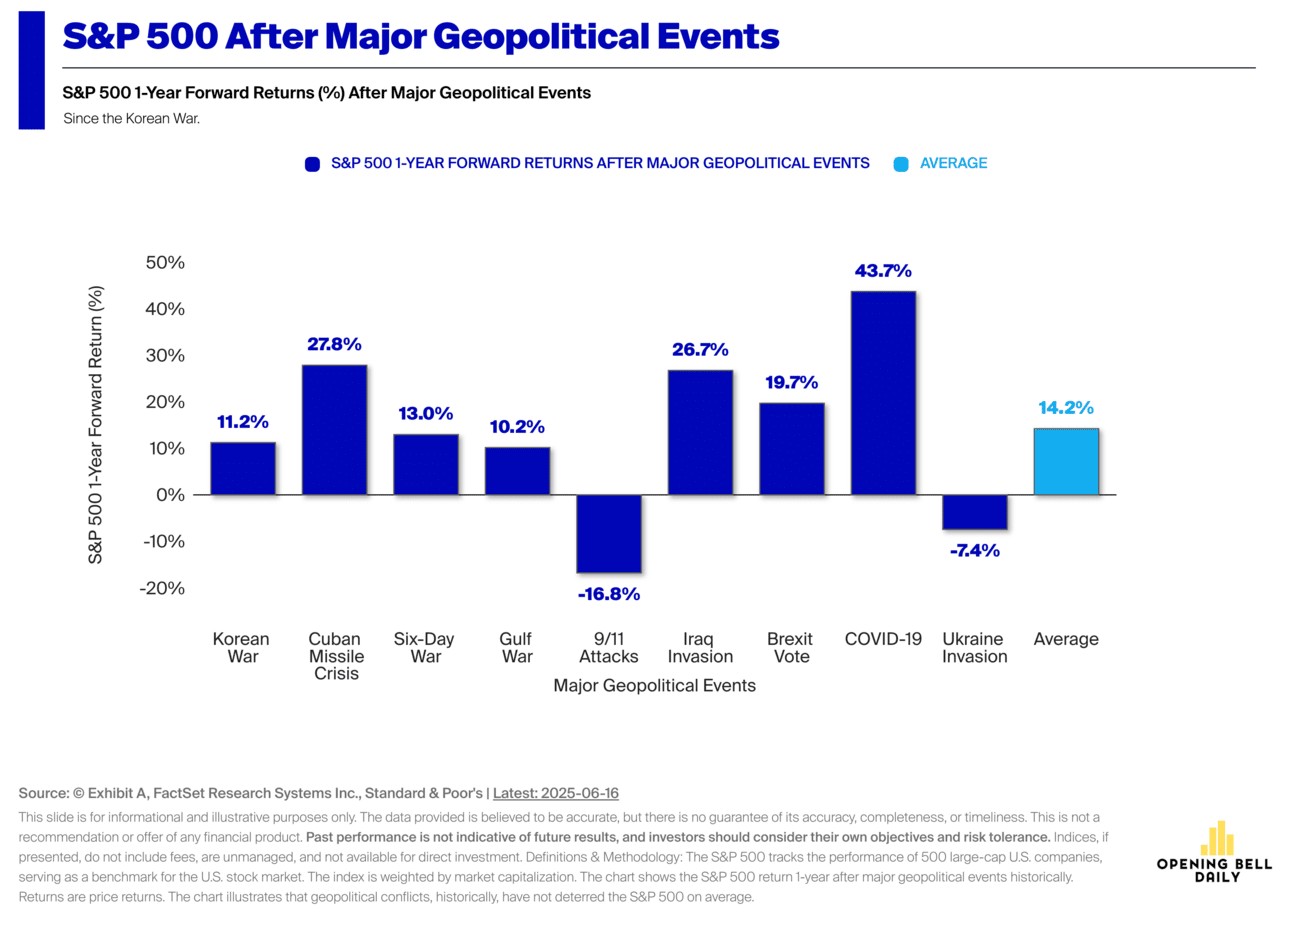
Israel-Iran war
Major crises breed higher markets in the aftermath. While geopolitics tends to exacerbate already-weak markets leading to sell-offs, severe market declines tend to be relatively short-lived. 12-month returns for stocks tend to be higher after the crisis with the exception of the 9/11 attacks because the market was still unwinding the dot.com bust and dealing with the 2001 recession. The Ukraine invasion is also negative because it came on Feb 24, 2022 at the start of tightening which led to lower markets the rest of the year.
M2 higher now than dot.com bubble
The chart highlights that tech stocks relative to M2 money supply is now higher than it was during the dot.com bubble.
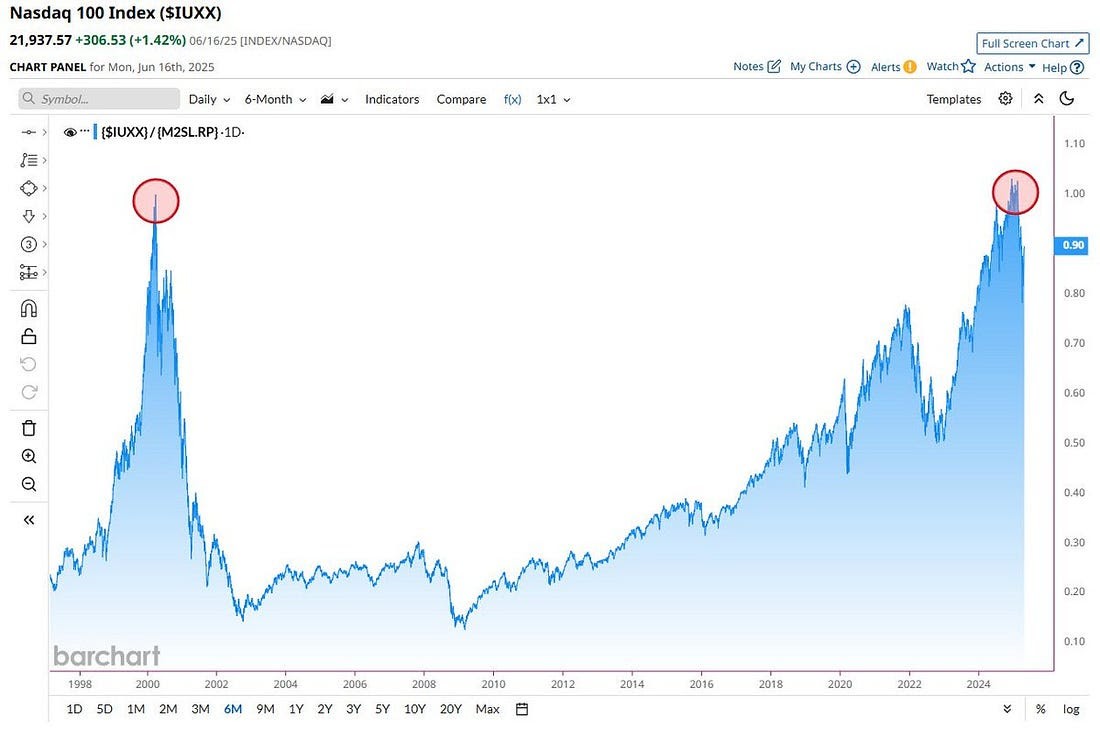
This implies a large relative overvaluation, but on the other hand, the tech industry has produced some of the best businesses humans have ever built. AI is the most revolutionary technology seen yet. AI, the bond market and geopolitical unrest place big demands on global liquidity which broke out early this year and is set to continue its upward trajectory. Global liquidity will determine the direction of stocks and crypto much more than the underlying fundamentals of any one asset.