
Current Focus List
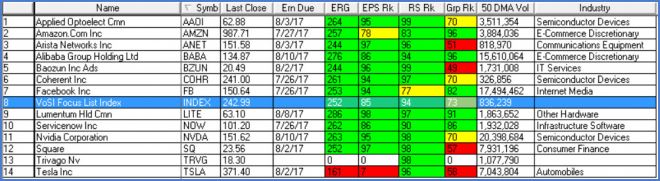
The VoSI Focus List is a compilation and reference list of stocks for which Pocket Pivot or Buyable Gap-Up Reports have been issued. It is not intended as a "buy list" or a list of immediately actionable recommendations. Stocks on the list may or may not be in proper buy positions, and investors should exercise discretion and proper judgement in determining when and where stocks on the Focus List can be purchased. The following notes are intended to assist in this process. Please note that members can enlarge the Focus List image by clicking on the body of the email and then holding the Control Key while pressing the "+" key until it is large enough to read.
General Observations:
The NASDAQ Composite Index is attempting to stabilize along its 50-dma following the ugly tech sell-off seen two Fridays ago. As long as the index can hold the 50-dma it stands a good chance of setting up again and making a bid for the prior highs. A breach of the line, of course, would be a very bearish development.
Meanwhile, the Dow Jones Industrials Index made a new all-time high on Friday, while the S&P 500 Index remains in a two-week flag price range. The small-cap Russell 2000 Index has drifted back into its 20-dema after failing to hold a new-high breakout earlier in the week.
Financials have remained an area of strength in the current environment as the potential for the rolling back of Dodd-Frank becomes more likely. According to some analysts, a rollback of Dodd-Frank could unleash $2 trillion of bank capital that has been idling because of Dodd-Frank.
In terms of meaningful rotation as tech stocks correct, financials remain the most obvious area of potential new leadership. However, we might expect that tech leaders still holding up in bases may return to their winning ways, perhaps in "Ugly Duckling" style, while new leadership among others techs, including bio-tech, and other formerly idle areas of the market may emerge in the coming days and weeks.
If the majority of prior tech leaders are going to spend some time correcting, then we would expect to see other areas of leadership begin to crop up in order to sustain the general market rally.
The Market Direction Model (MDM) is now on a buy signal. The VIX Volatility Model (VVM) is now on a sell signal.
Removed from the List this Week:
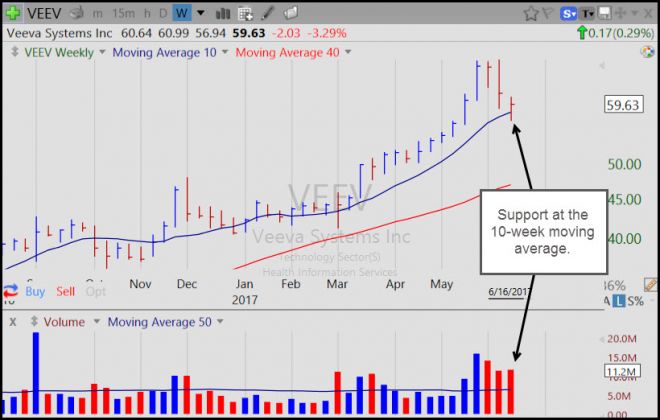
Box (BOX), The Chemours Company (CC), JD.com (JD), Momo (MOMO), Netflix (NFLX), Trade Desk (TTD), Veeva Systems (VEEV),and Wix.com (WIX). These names have broken near-term support, but in some cases, as with TTD and VEEV, the stock have broken hard down towards their 10-week moving averages on the weekly charts. We will continue to monitor these stocks, however, since those that are able to hold support at the 10-week lines may simply need some time to build new bases and set up again. If we see this occur in any of these stocks, we will likely add them back to the list.
A good example would be VEEV, which has broken down hard but found support at its 50-day/10-week moving averages on the daily and weekly charts. While an instantaneous rebound back to the highs is very unlikely, the stock could retest the moving averages in an ongoing base-building process as it consolidates what was a very strong prior upside move.
Focus List Stocks Expected to Report Earnings this Week: None.
Notable Action:
Applied Optoelectronics (AAOI) found support at the 50-dma and the top of its prior base on Thursday.
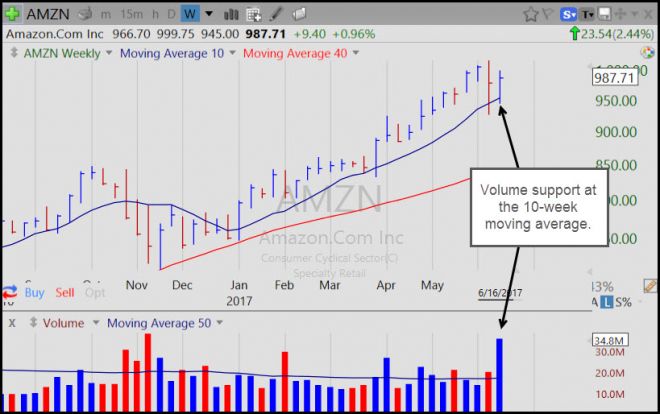
Amazon.com (AMZN) announced on Friday that it was buying Whole Foods Market (WFM), sending the stock within a quarter-point of the $1,000 Millennium Mark. The stock failed to clear back above the 1,000 level and reversed to close back below its 10-day moving average. Note that AMZN did find support along its 50-day moving average, and on the weekly chart below this shows up as volume support at the 10-week moving average.
Alibaba (BABA) is testing its 10-dma and is less than 1% below the 135.21 intraday low of its July 8th buyable gap-up move. This puts the stock in a lower-risk entry position using the 10-dma as a selling guide.
Arista Networks (ANET) found volume support at its 10-week moving average on the weekly chart.
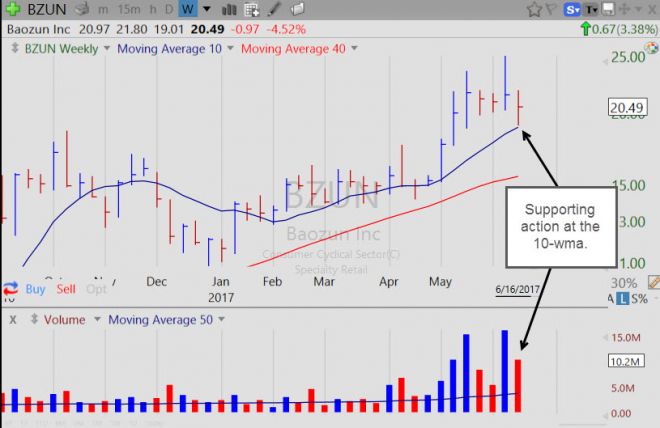
Baozun (BZUN) found support at its 10-week moving average this past week following a failed base breakout attempt last week. We would also note that on the daily chart the stock undercut and rallied back above its May 25th low in the base at 19.81. This sets up a U&R long entry using the 19.81 low as a tight selling guide.
Coherent (COHR) found support at its 10-week moving average. Watch for a constructive retest of the line as a potentially lower-risk entry opportunity.
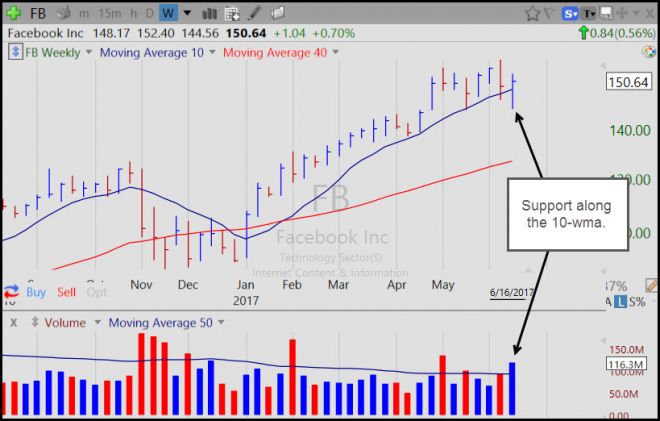
Facebook (FB) also found support at its 10-week moving average following a failed base breakout attempt last week. The stock does have the look of a late-stage breakout-failure, but the fact that FB sells at 20 times next year's earnings means it is not an "overvalued" situation that will readily be tossed out the window by institutional portfolio managers.
Nvidia (NVDA) is holding tight along its 10-dma after a massive-volume reversal off the peak two Fridays ago. Volume is declining as the stock drifts higher along the rising 10-dma, which may imply that a further pullback is coming.
ServiceNow (NOW) is holding above the $100 Century Mark, and is also holding well above its 50-day and 10-week moving averages on the daily and weekly charts.
Trivago (TRVG) is holding along the lows of its current five-week base with volume drying up to -64% below average on Friday. This coud put the stock in a lower-risk entry position using the lows of the current pattern at 18 or the 50-dma as a maximum downside selling guide.