
When Will the VIX Spike Next?
By Dr. Chris Kacher, Managing Director, MoKa Investors, LLC
The chart below shows events that led to spikes in the VIX since 2014:
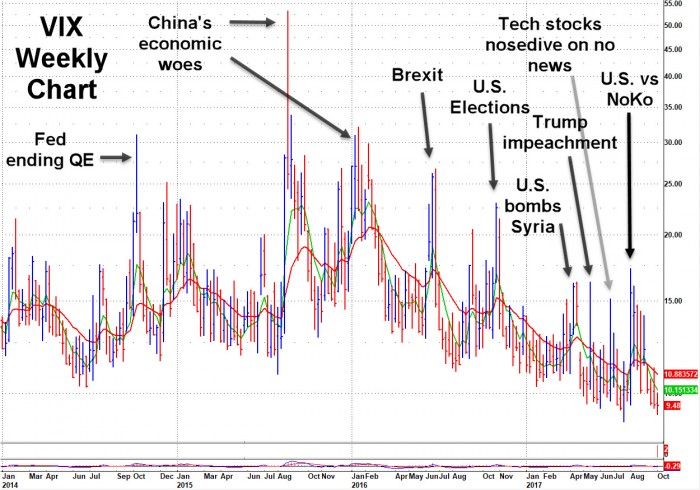
As you can see, the VIX is once again nearing all-time lows.
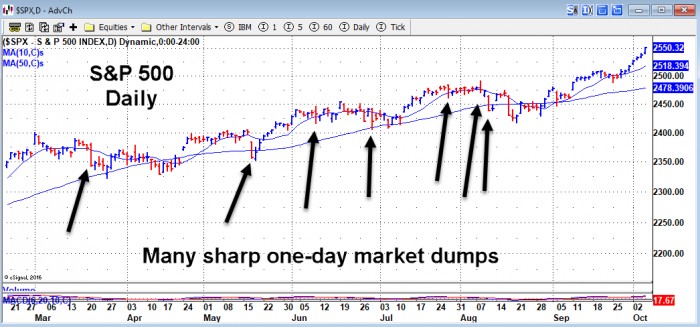
Meanwhile, markets continue relentlessly higher in baby steps which are followed by one-day dumps where up to a few weeks of profits can be reversed in one day:
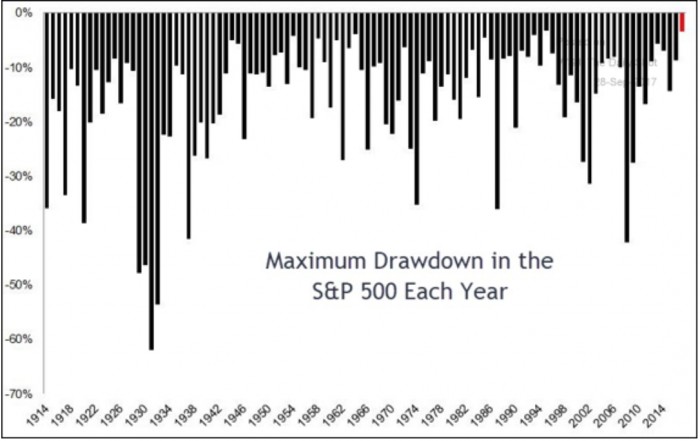
Further, the S&P 500 has corrected the least this year so far going all the way back to 1914:
While 2009-2016 have been treacherous years for market timing given the QE manipulations which rendered many tried-and-true indicators null and void, 2017 wins hands down for most treacherous market. Indeed, most all of the market timing sites that were competing with VoSI in 2009 have gone out of business over the years proving that black boxes do not work.
Sidebar: Timing Strategies
That said, Market Direction Model has managed to retool over the last 18 months to where it is up strongly since mid-2016. "Model" is a misnomer since models imply static, non-changing strategies which are ultimately doomed to failure. MDM has had to pivot at critical times such as in early 2009 when QE began. That's not to say it has always been successful in pivoting during this unprecedented QE environment that began in 2009. But keeping a clear head, remaining flexible, and staying alert to change has been key to getting back on track. This applies to all forms of trading when one is losing money.
While buy-and-hold for the first time in market history has outperformed most other standard strategies, its success is driven by QE which prevents the markets from having meaningful corrections. This has been true since 2009. The S&P 500's largest correction since 2009 has been roughly 20%. Hindsight, of course, is 20/20.
As you know, VIX Volatility Model transformed into Trading Volatility Report. Meanwhile, the pre-April 3 version of VVM continues to outperform. I continue to trade both the former and current versions in my own accounts at my own risk. I will be using the Trading Volatility Report as a vehicle to suggest entry and exit points in UVXY and XIV. I also have a longer-hold version of VVM which I played in my IRA as it switches signals far less frequently. In this environment, holding wider banding uptrends has worked best by far. That said, such strategies can have larger drawdowns since the exit point is further away. And we all know that at some point, the market will have a serious correction.
The Solution: The UVXY 620 MACD strategy can be used not just as a way to handsomely profit when the VIX spikes as we have discussed in prior reports, but also as a hedge against holding wider banding uptrends. On the first day of a VIX spike, one could buy the UVXY when its fast line moves above its slow line as we have discussed. The number of false signals will outweigh the number of true signals but the gains achieved on true signals will more than compensate for the small losses which are typically 1% or less depending on how tight you wish to keep your stop.
First Timing Strategies, Now Leading Stocks?
QE market manipulations which first greatly challenged trend following as shown by the poor performance by the trend following wizards since 2009, now seem to also be targeting leading stocks as of the last few months. Stocks may have one strong up day only to see it immediately reverse. Stocks may break below their 50-dma only to immediately roar back, such as NFLX did recently which we refer to as a moving average under & rally entry point. Breakouts often fail (though this has been true for quite some time) and breakdowns often bounce back.
But again, wider banding hold times in the strongest names using the 7-week sell rule that we discuss in our books continues to work. The challenge, however, is finding those strongest names as such names are few and far between in this QE-rattled market. And when you find one or two, using the 50-day moving average can put your account at greater risk in this environment where leading stocks often lose 3-5x what the major averages lose, so using the UVXY as a hedging instrument can reduce the overall volatility in your account.
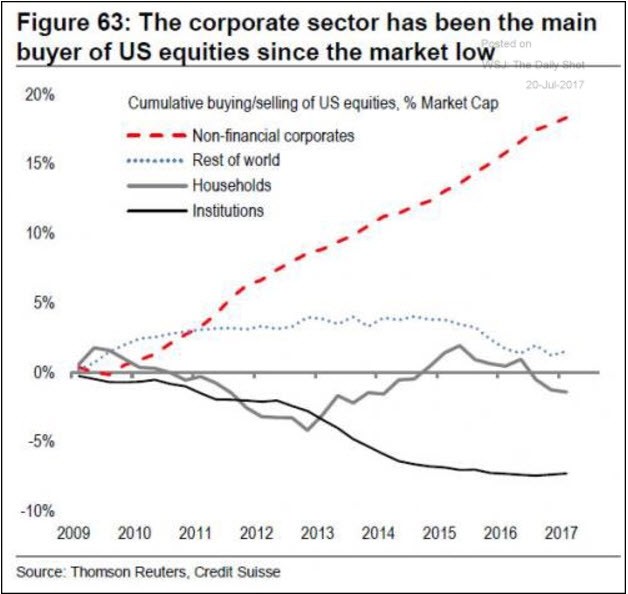
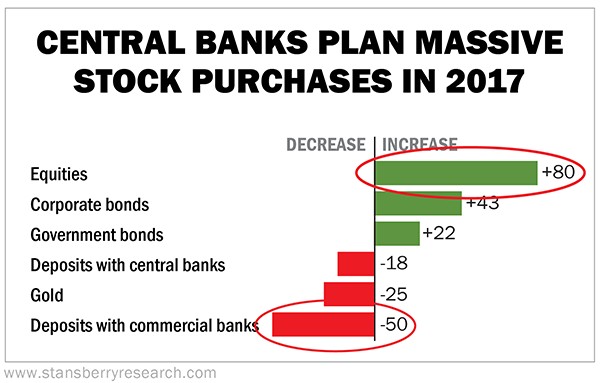
Meanwhile, the general stock market grinds higher with profits reversing fast when the market has even a minor correction. This abnormal action can be attributed to stock buybacks by corporations and central banks which are at all-time highs due to QE:
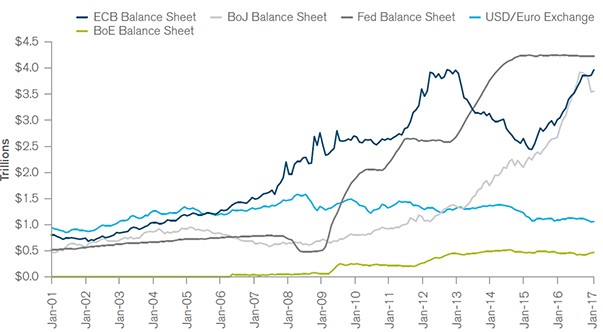
And the QE money-printing machine rages on at record levels:
When Will The VIX Spike Next?
With the VIX near all-time lows, and leading stocks becoming deep sell-off targets, the market may be reaching the end of its rope. Singularly, the corner is getting tighter and tighter in terms of profit opportunities.
Ultimately, the UVXY 620 MACD will show you when to enter as we have discussed in prior reports.
That said, based on the first chart in this piece, the reasons behind a spiking VIX have been:
1) geopolitical tensions
2) Trump-related, ie, impeachment
3) global economic woes
One-time events have been:
1) the presidential election
2) Brexit
3) the Fed ending QE
The wildcard is the time the VIX spiked on July 27, 2017 when leading technology stocks sold off on new particular news. They then got hit again in the ensuing weeks.
Thus, the next VIX spike could be news driven or it could spike on no particular news. Therefore, it comes down, once again, to watching your stocks, and in this case, watching the UVXY 620 MACD. But given where things stand in terms of a record low VIX and an overbought market, the odds favor a spiking VIX sooner than later.