
Market Lab Report
by Dr. Chris Kacher
The Web3 Evolution Will Not Be Centralized™
Where are we in the Bitcoin bull?
Bitcoin remains firmly in its bull cycle that began in Jan 2023 when we first alerted members after bringing them to safety in Nov 2021 when the Fed said they would start tightening. Most of the popular talking heads in the cryptospace on YouTube did not understand the importance of this event because they did not understand macros until more recently so they remained bullish for much of 2022. That said, it was not until Oct 2023 that Bitcoin really started to trend higher at a faster ascent with the rumors of a potential Blackrock Bitcoin spot ETF.
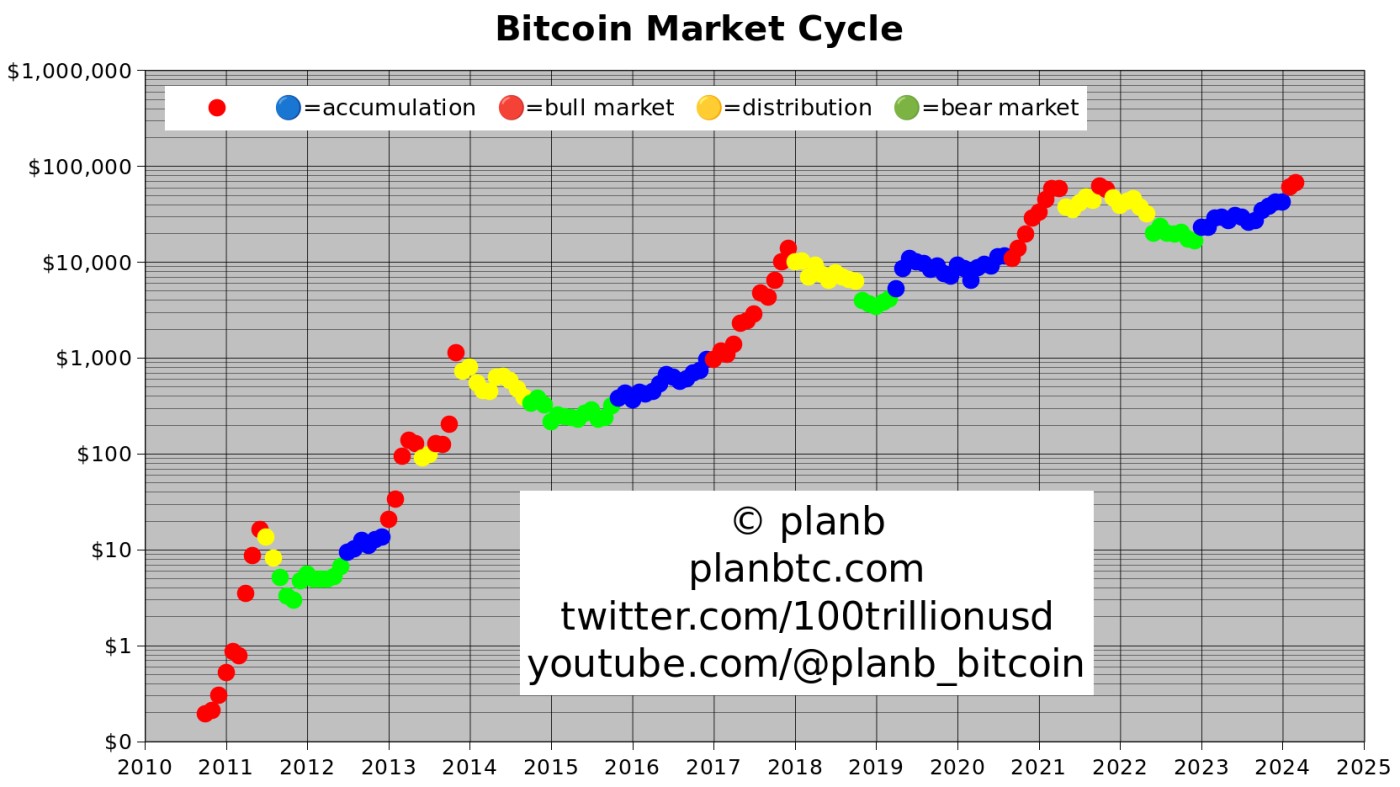
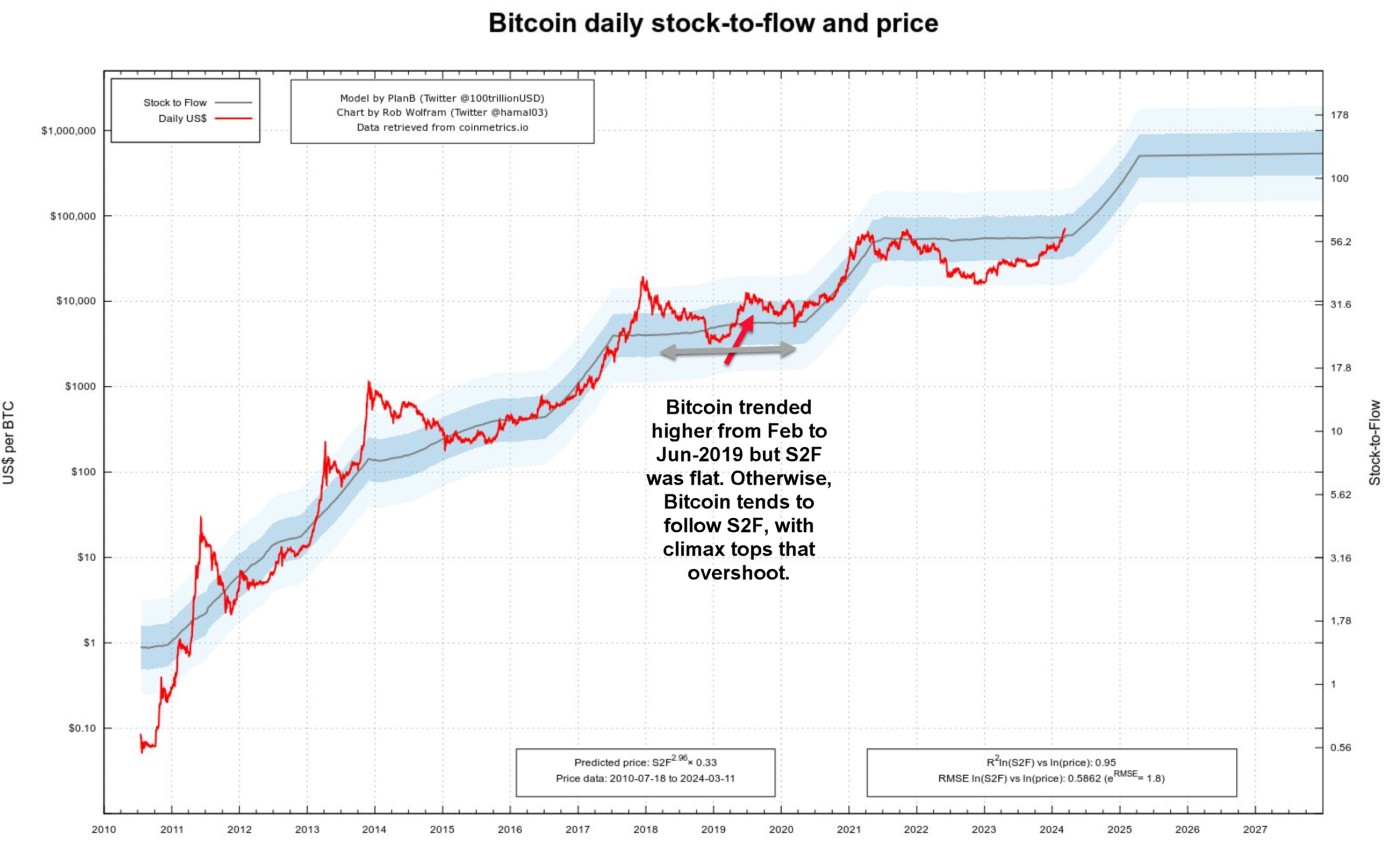
In terms of where we are in this Bitcoin bull, the first graph shows the stock-to-flow ratio of Bitcoin. S2F refers to the ratio of the current stock of a commodity to its annual production or flow. It has approximated the price of Bitcoin since it was created in 2011. We are still early as denoted by the red dots on the S2F plot. Each dot is one month.
The next graph shows how Bitcoin realized price (cost base) is rising, but still very slowly (5-10% per month: green). The current market is comparable with the other green dot clusters in mid-2012, begin-2017, and Oct-2020. In 2019, notice how the green dots end prematurely.
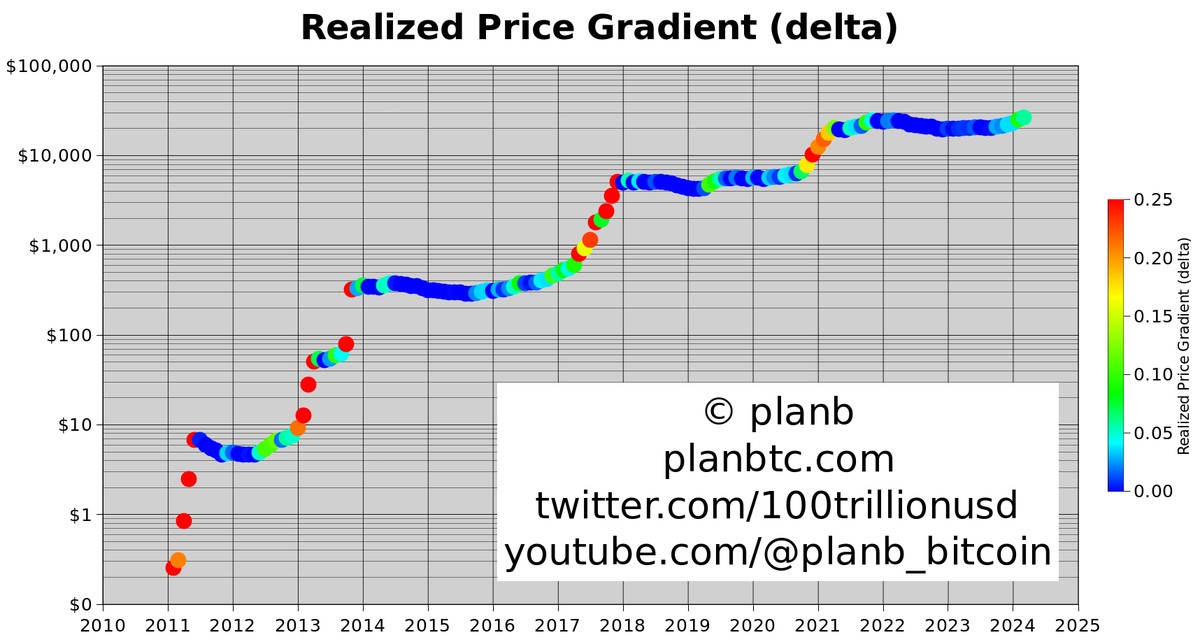
This was the only time Bitcoin's bull market stopped short, lasting only 5 months from Feb to Jun because the S2F ratio was still in its flat period as shown in the next graph. This bullish aberration that lasted 5 months was due to the Federal Reserve announcing in Jan-2019 that they would stop hiking rates which was bullish for cryptocurrencies.
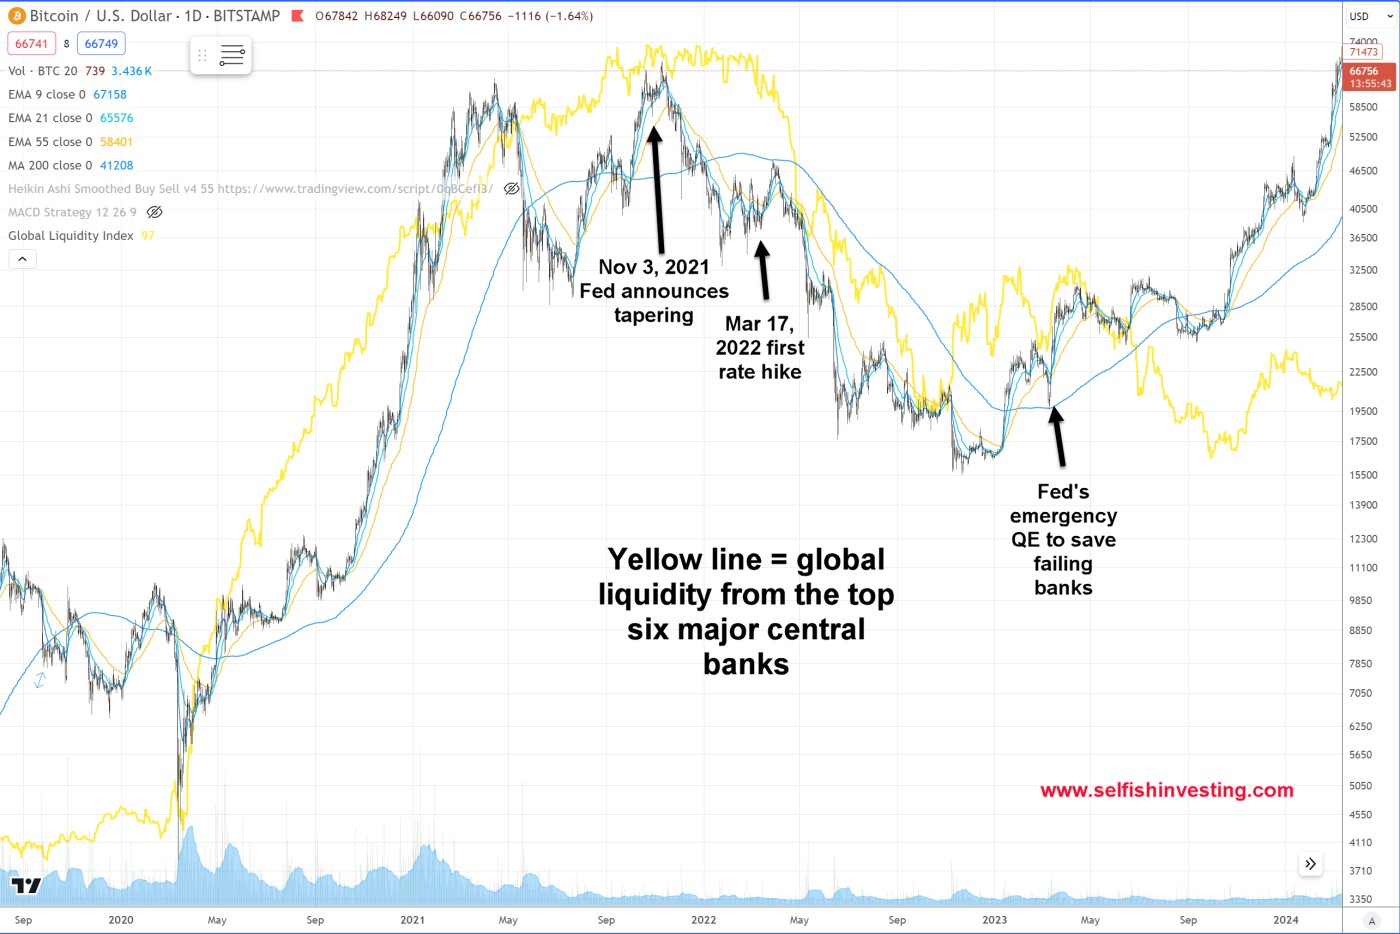
As I have demonstrated across numerous reports, macro is very important in learning to properly time Bitcoin. Macro dictates liquidity which correlates with the price of Bitcoin. The next chart shows that when the Fed said they would start tapering on Nov 2, 2021 as we mentioned in a report at that time, then started hiking rates on Mar 17, 2022, the cryptocurrency market tumbled for most of the year. The market direction model did well overall with two huge back-to-back gains in 2022 despite hedge funds in both stocks and cryptocurrencies losing money hand over fist. This was a replay of 2018. It was then only in late 2022 that global liquidity out of China followed by liquidity from the US pushed Bitcoin into a strong but brief uptrend at the start of 2023. Bitcoin then had another boost in price in March 2023 when the Fed launched emergency QE to save major banks such as Silicon Valley Bank.
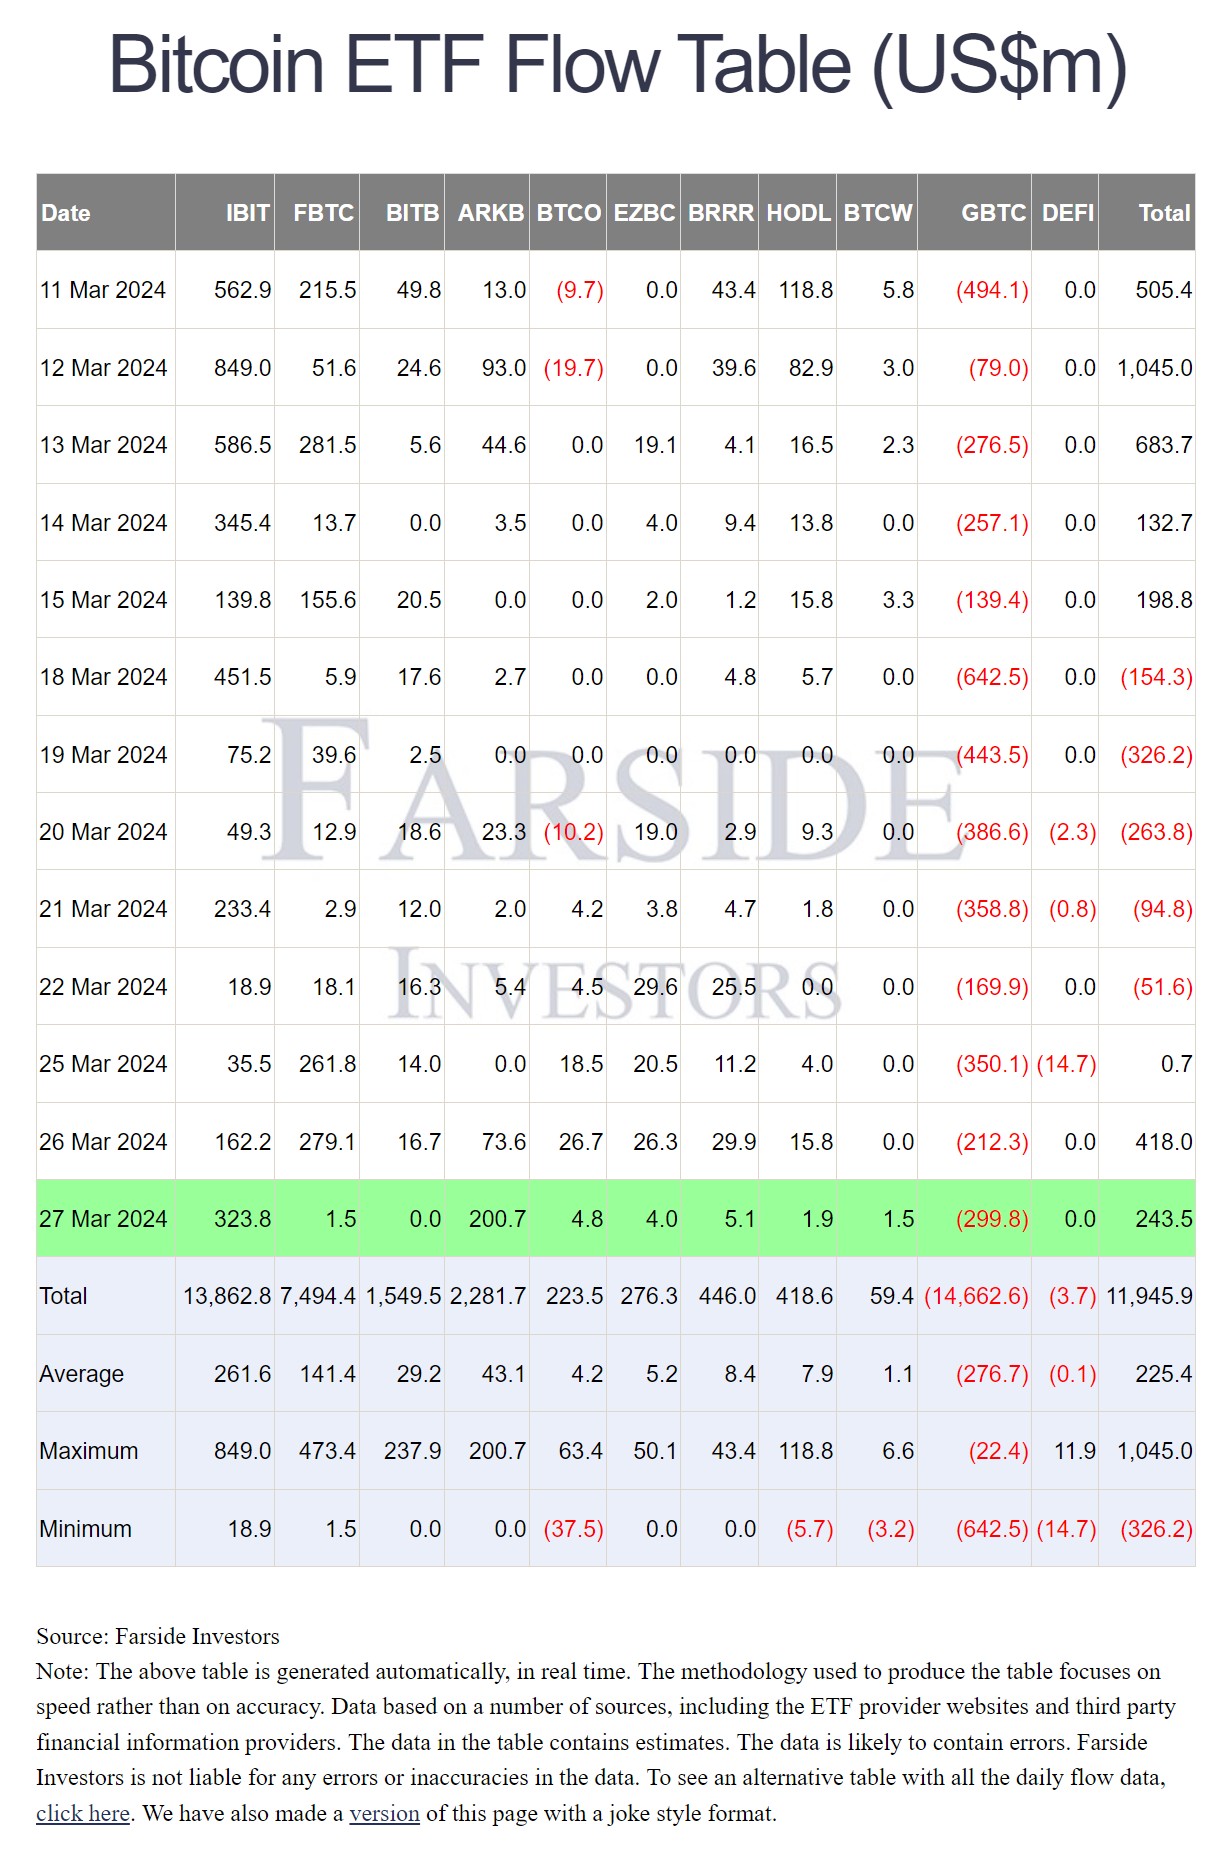
At present, global liquidity continues to trend lower since the start of this year. Offsetting that have been the net positive inflows into Bitcoin spot ETFs up until this past week due to the correction in Bitcoin.
Smaller positive inflows into Bitcoin spot ETFs were outmatched by investors selling their GBTC. I would expect that due to more institutional funds coming "online" in the coming weeks in terms of setting 1-2% mandates to expose their portfolios to Bitcoin, net inflows will once again be overall positive. Indeed, on Tuesday, net inflows bounced back to $418 mil then to $243.5 mil on Wednesday.
Also, retail is just starting to notice Bitcoin once again. In past bull markets, this was a sign of still being in the earlier stages of the Bitcoin bull.
The recent negative net ETF flows were due to the correction in BTC from concerns about inflation which were soothed after Powell's dovish testimony last Wed. Expect net ETF flows to trend higher once again as major institutions with 1-2% BTC mandates come online. In other words, investors who buy their mutual funds will be exposed to 1-2% of BTC. Every time an investor buys, the fund manager will have to buy 1-2% BTC.
A sizeable segment of institutional players remain on the sidelines. That said, some have begun to green-light spot Bitcoin ETFs for inclusion in advisor-managed portfolios.
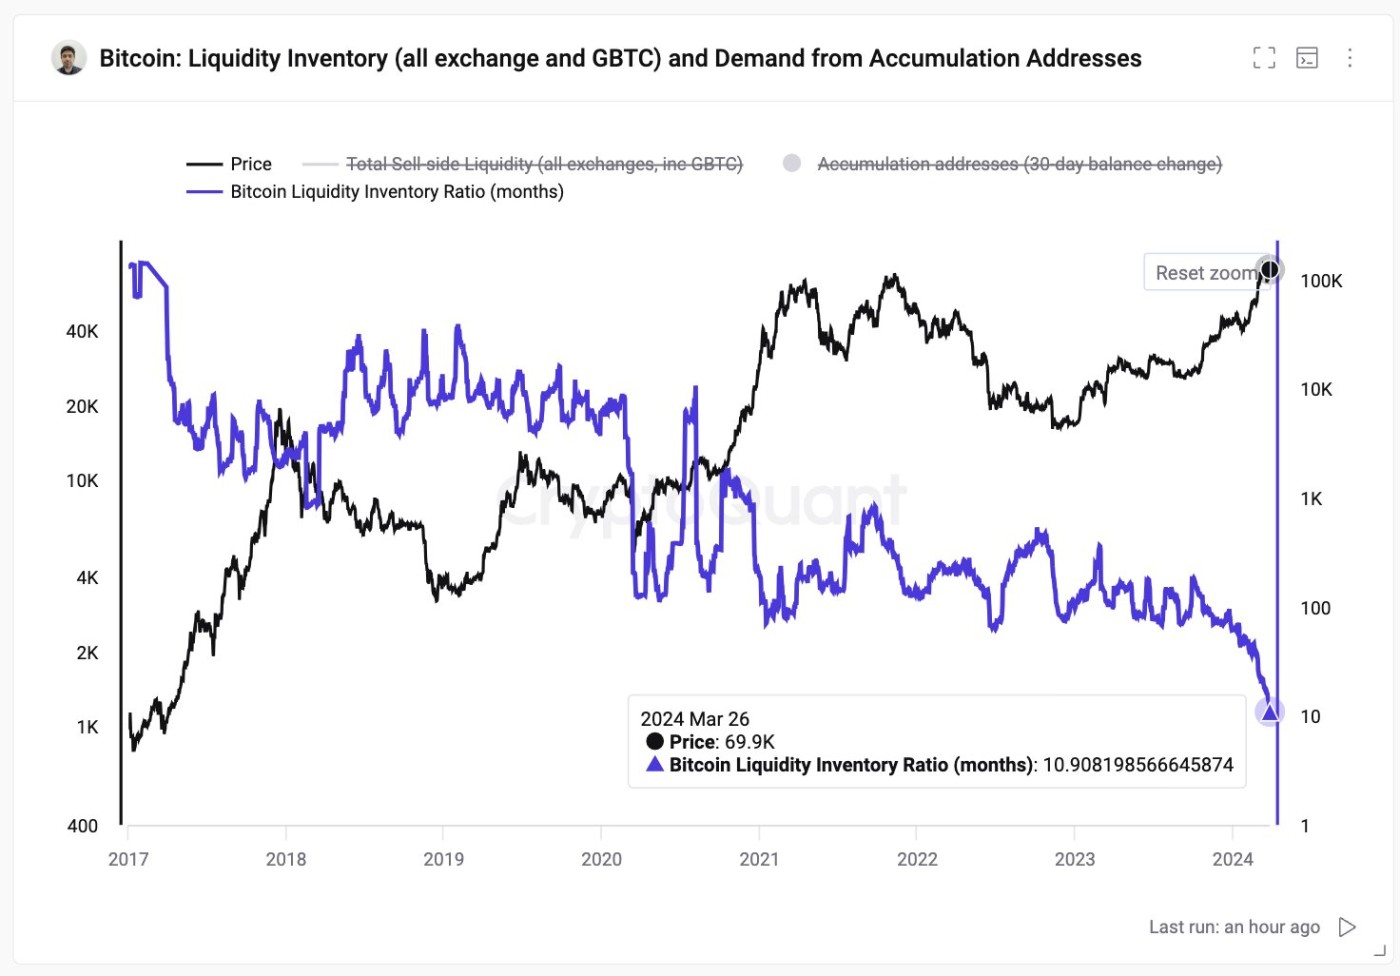
Another bullish indication for Bitcoin is supply side liquidity is at a multi-year low. Supply will fall even further after the Bitcoin halving on April 19.
All of the above said, while there are numerous positives about why Bitcoin should continue to trend higher overall, global liquidity continues to trend lower this year. Offsetting that is stealth QE such as global central banks having to pay the massive interest on record levels of debt. A $1.2 trillion spending package was just approved in the US.
Reader beware
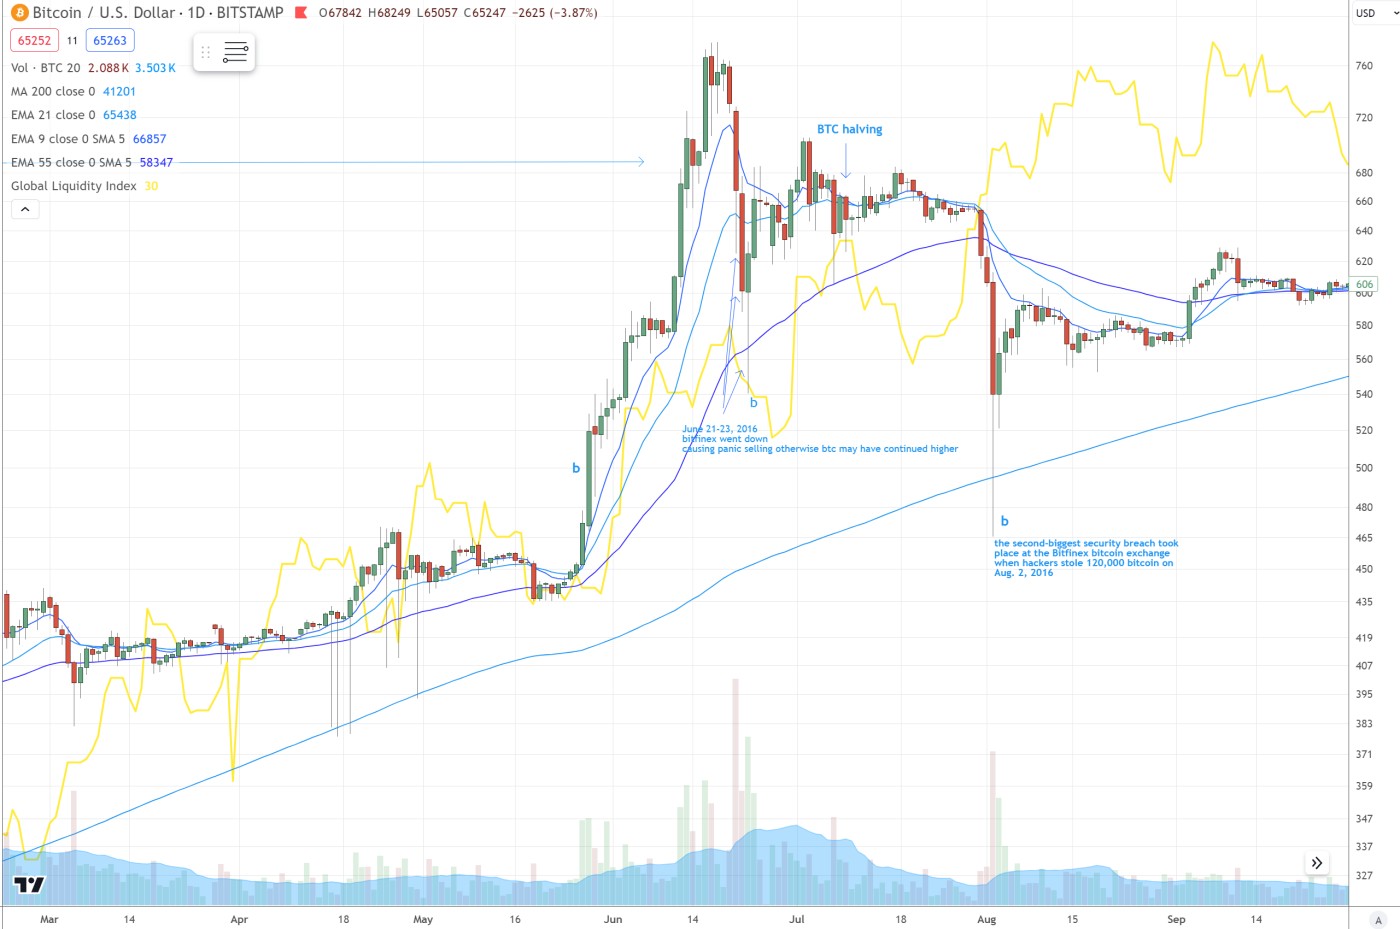
Just as with buyer beware, there is a minefield of wrong information supplied by some of the most popular publications and YouTube talking heads in the cryptocurrency space. In 2022, nearly all of the most popular YouTubers remained bullish for most of the year, losing massive sums for their listeners. In the publication arena, a number of advisory sites such as Glassnode, one of the most popular in the cryptocurrency space, recently incorrectly wrote, "For instance, in 2016, the market experienced a sharp sell-off from around $760 down to $540 - a correction of approximately 30% - right around the time of the halving. This drop was a classic example of market participants reacting to the event itself rather than its long-term supply implications, showcasing the halving's capacity to trigger immediate market volatility."
This is factually incorrect. The big drop was due to Bitfinex, a major exchange, crashing.
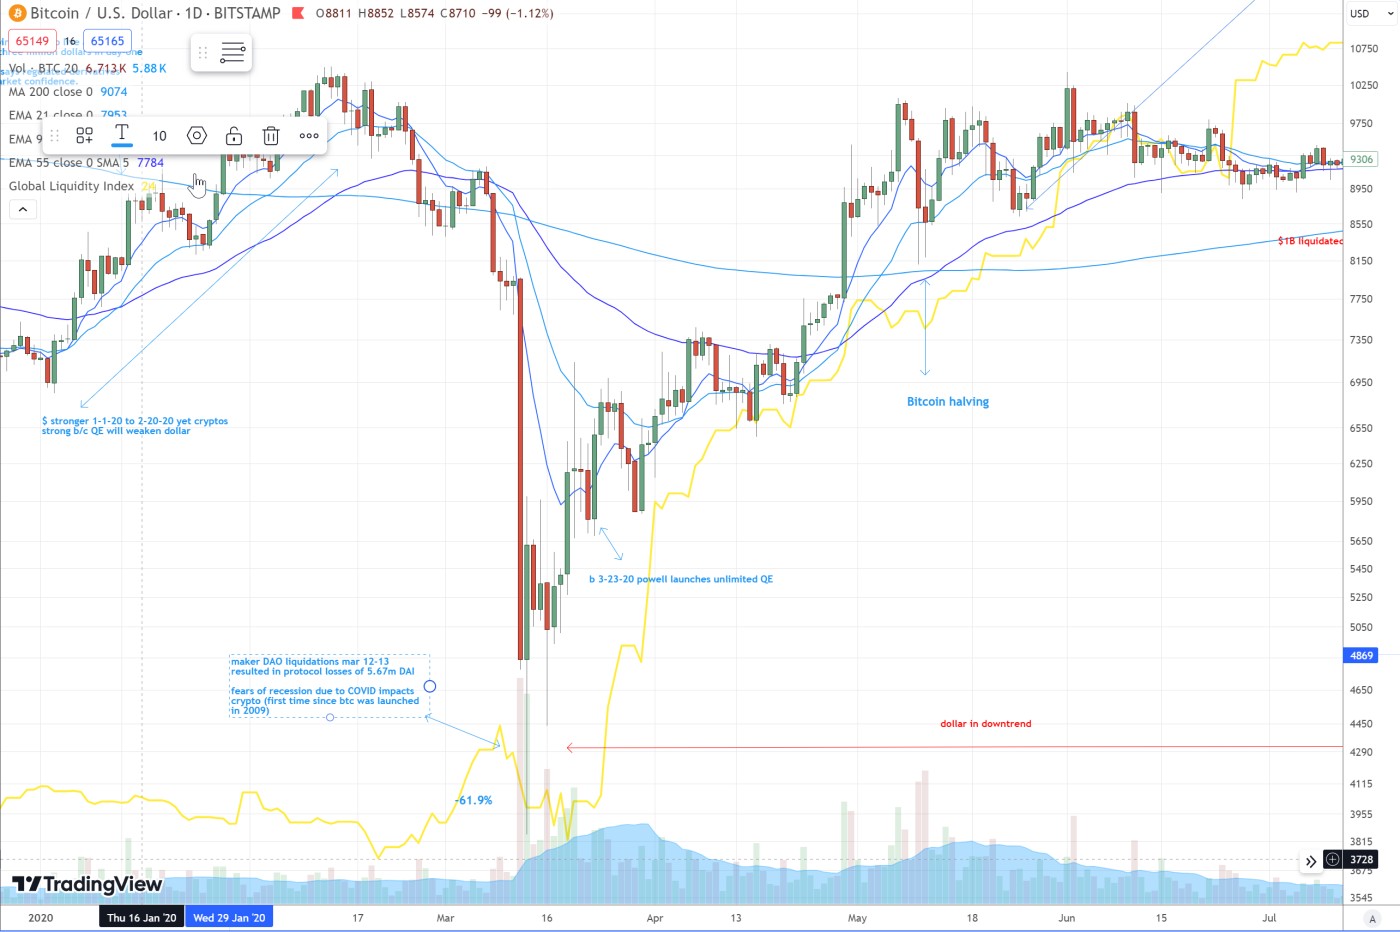
Then in 2020 a couple of months before the halving, Bitcoin plummeted due to fear of recession due to COVID and Maker DAO liquidations.
So make sure you examine what is reported since the "facts" can be taken out of context or just plain wrong.
Furthermore, Anthony Pompliano in his daily newsletter commented on the reduction in global liquidity since the start of this year where he wrote, "But if asset prices have continued to rise, despite the tighter financial conditions, then we must ask the question 'what happens when loose monetary policy returns and global liquidity begins growing aggressively again?' The simple answer is that asset prices will take off, just as we saw in 2020 and 2021."
While this is possible, it is also just as possible that a reduction in interest rates underscore an economy heading towards recession. We have had a number of cycles where the Fed's first rate cut was the start of a major bear market as the Fed was behind the curve so the economy tanked into recession. Cryptocurrencies have never been through a prolonged recession. The only example is Mar-2020 when COVID hit when cryptocurrencies crashed. The Fed then stepped in that same month and started blasting QE into the markets.
So Pampliano's assumption that asset prices will just take off is very incomplete. The utility from AI and the ongoing stealth QE from major central banks could postpone recession. So postponed rate cuts could be good for the markets as long as the economy remains decent. So far, based on the questionable-at-best jobs data, GDP numbers, and inflation figures, this has been the case. Let's see how much longer they can kick the can down the road by manipulating facts and pumping QE, stealth or otherwise, into the markets which so far continues to help stocks and cryptocurrencies.