
by Dr. Chris Kacher
Why the bull keeps running
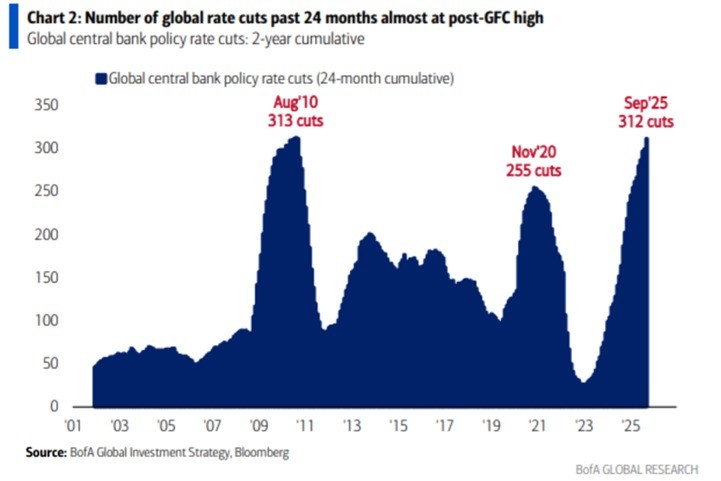
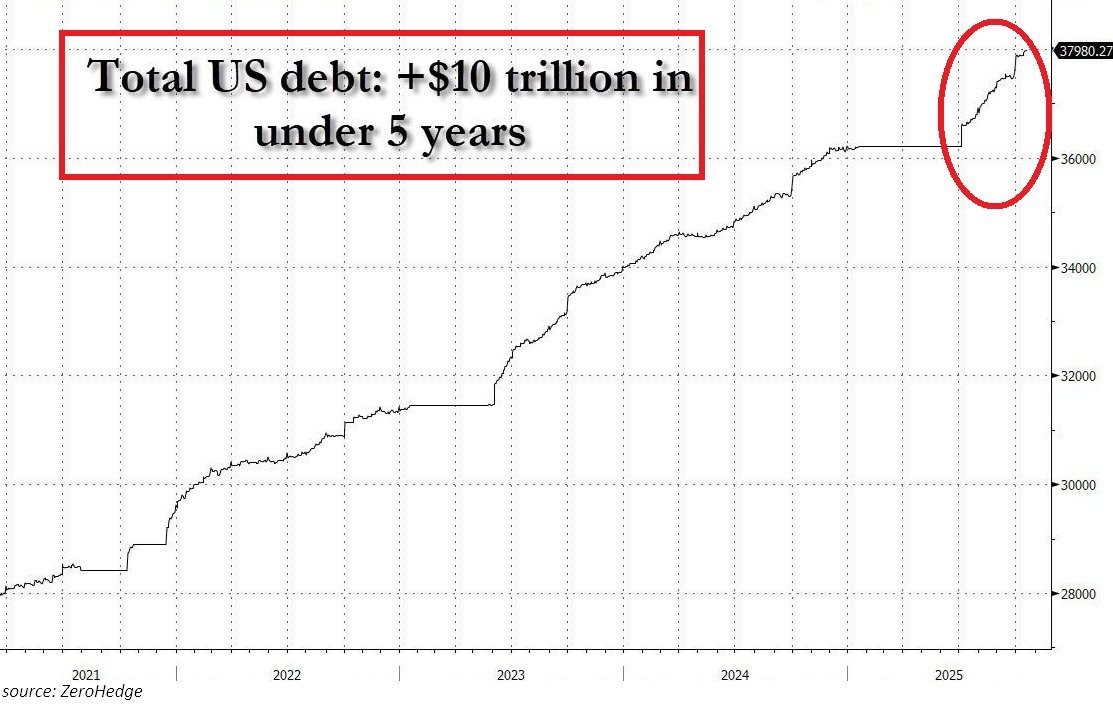
World central banks have cut rates 312 times over the last 24 months, the 2nd-highest total in at least 25 years. This is just one rate cut below the response to the 2008 Financial Crisis. By comparison, the 2020 pandemic brought 255 cuts. This also marks a massive jump from just 30 rate cuts during the 2022–2023 period. Central banks are slashing rates at a pace only seen during recessions. So while some say interest rate cuts always lead to recession, they are only taking in two data points: rate cuts in 2001 and 2008 which led to recession, while ignoring cuts in the 1990s which did not lead to recession. Further, 2001 and 2008 are only two data points, and both can be explained by one-offs: the dotcom bubble burst and the global financial crisis (GFC). The current situation of aggressive rate reduction in the face of inflation remaining above central bank targets and strained growth is unprecedented, brought on by record levels of global debt which has reached a record $338 trillion, up from $305 trillion a year ago. Meanwhile, total US debt officially crossed above $38 trillion for the first time in history. This marks a +$500 BILLION jump this month, or +$23 billion per day.
Debt leads to more debt as debt interest grows. This necessitates the need for central banks to create more fiat which further devalues fiat, creating a “monetary flywheel” where inflation, easing, and new debt feed each other. Effectively, the world’s major economies are attempting to sustain moderate growth through renewed monetary easing in an environment of stubborn inflation and record leverage, a scenario unprecedented in modern financial history. Global monetary easing remains in full swing.
The money printer hasn’t run this hot since COVID. The higher the national and global debt go, the higher stocks, precious metals, real estate, and bitcoin will go. And it doesn’t appear this will stop any time soon.
Global M2 money supply now stands around ~$137 trillion. It was $129 trillion just 6 months ago.
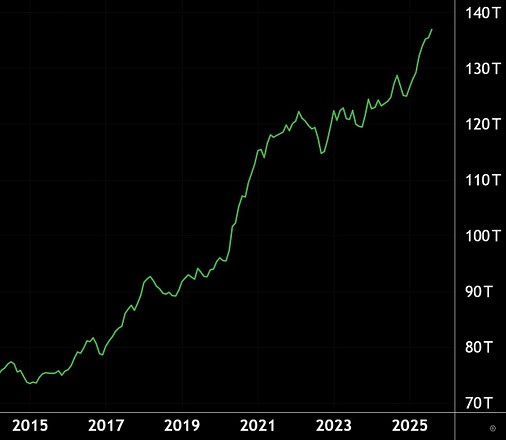
Note how the slopes increase in both cases so far in 2025 compared to prior years with COVID starting in 2020 being the exception.
Dotcom vs AI bubble
Leading tech companies such as NVDA, AAPL, and MSFT currently trade around 30x forward earnings while generating record cash flows and profitability and GOOGL looks even cheaper. Back in the late 90s near the height of the dotcom bubble, CSCO and ORCL traded above 120x earnings while Microsoft’s multiple was roughly double its current level.
Furthremore, big tech companies driving this cycle are producing hundreds of billions in annual free cash flow unlike the leaders of the dot-com era which made far less. Bubbles pop when technology fails to monetize. The companies pushing AI forward are the most profitable businesses in history and help drive real productivity gains.
Calling the whole AI sector a bubble pushes mainstream media to assume every time we start into a market correction is the start of the bear market. That many keep trying to call the top as the major averages continue to hit new highs over the last many years is one reason the saying holds: Markets can remain irrational longer than one can stay solvent. But irrational is relative. Some of the biggest money is made over a span of years while markets allegedly remain irrational.
In healthcare alone:94% of healthcare organizations see AI as core to operations; 86% use AI extensively.
U.S. AI in healthcare revenue to exceed $100 billion annually by 2030.
Number of FDA-approved AI medical devices rose over 100-fold from 6 in 2015 to 692 by 2023, with 77% in radiology.
65% of U.S. hospitals use AI predictive analytics; those hospitals reduce readmission rates by up to 50%.
Diagnostic imaging AI market expected to surpass $20 billion by the late 2020s.
In Professor David Sinclair's lab, he took old mice, near the end of their natural lifespan, gave them a chemical cocktail for four weeks, and every single mouse got younger. Not just healthier, measurably younger, according to their frailty index. According to Sinclair, "AI is changing everything. What we do now in a month would've taken thousands of years to accomplish with traditional methods." After making old mice young again in both body and mind, Sinclair put out the video a few months ago saying within ten years, you will take a pill and get materially younger.
Ed Yardeni was one of the few Wall Street commentators who hasn't yet bought into the recession chatter. "Corrections tend to occur when investors fear a recession that doesn’t happen,” Yardeni said. “Bear markets tend to be caused by recessions. Currently the economy remains resilient, and a recession is unlikely, in our opinion.”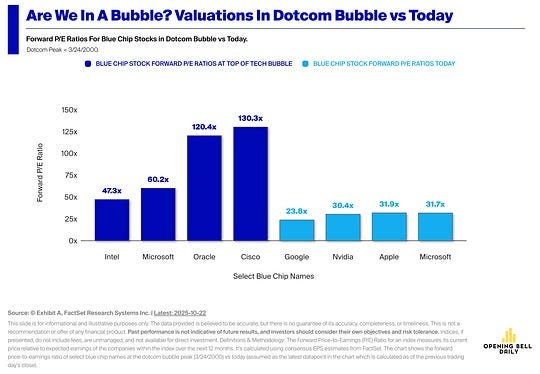
Of course, with expectations so high, any missteps would result in a fast correction. But as discussed in prior reports, the major bottleneck is likely hardware which is unlikely to hit for at least another year or more.
Why demand for gold is soaring
As to why the demand for gold has skyrocketed, throughout history, nations have repeatedly used economic sanctions as a substitute for direct military conflict, since financial pressure is less costly than warfare. When countries clash, they often block opponents’ access to money, resources, or trade. For example, the U.S. froze Japanese assets before World War II and Russian reserves after the Ukraine invasion. Such actions are standard.
The U.S. as a leading global power uses sanctions with increasing regularity as geopolitical uncertainty heightens. This gives the U.S. the double benefit of hurting opponents financially while also reducing its own debt service burdens.
The debtor country experiences the second-order consequences of weakening its credibility as a debtor, its currency value, and the demand for its debt. While this is advantageous to the U.S., there is no free lunch as this dynamic also weakens the global monetary order. As a result, fiat declines overall relative to the price of gold while buying of gold by central banks pushes gold higher. Central banks see gold as a safe haven because it cannot be easily frozen or devalued.
Trade deal comingAnother tailwind for the markets is the tariffs issue with China. US Treasury Secretary Scott Bessent said Trump’s threat of 100% tariffs on Chinese goods “is effectively off the table”. This came after the US and China said they came to terms on a range of contentious points.