
Did gold and silver hit a major top? [2011 vs today]
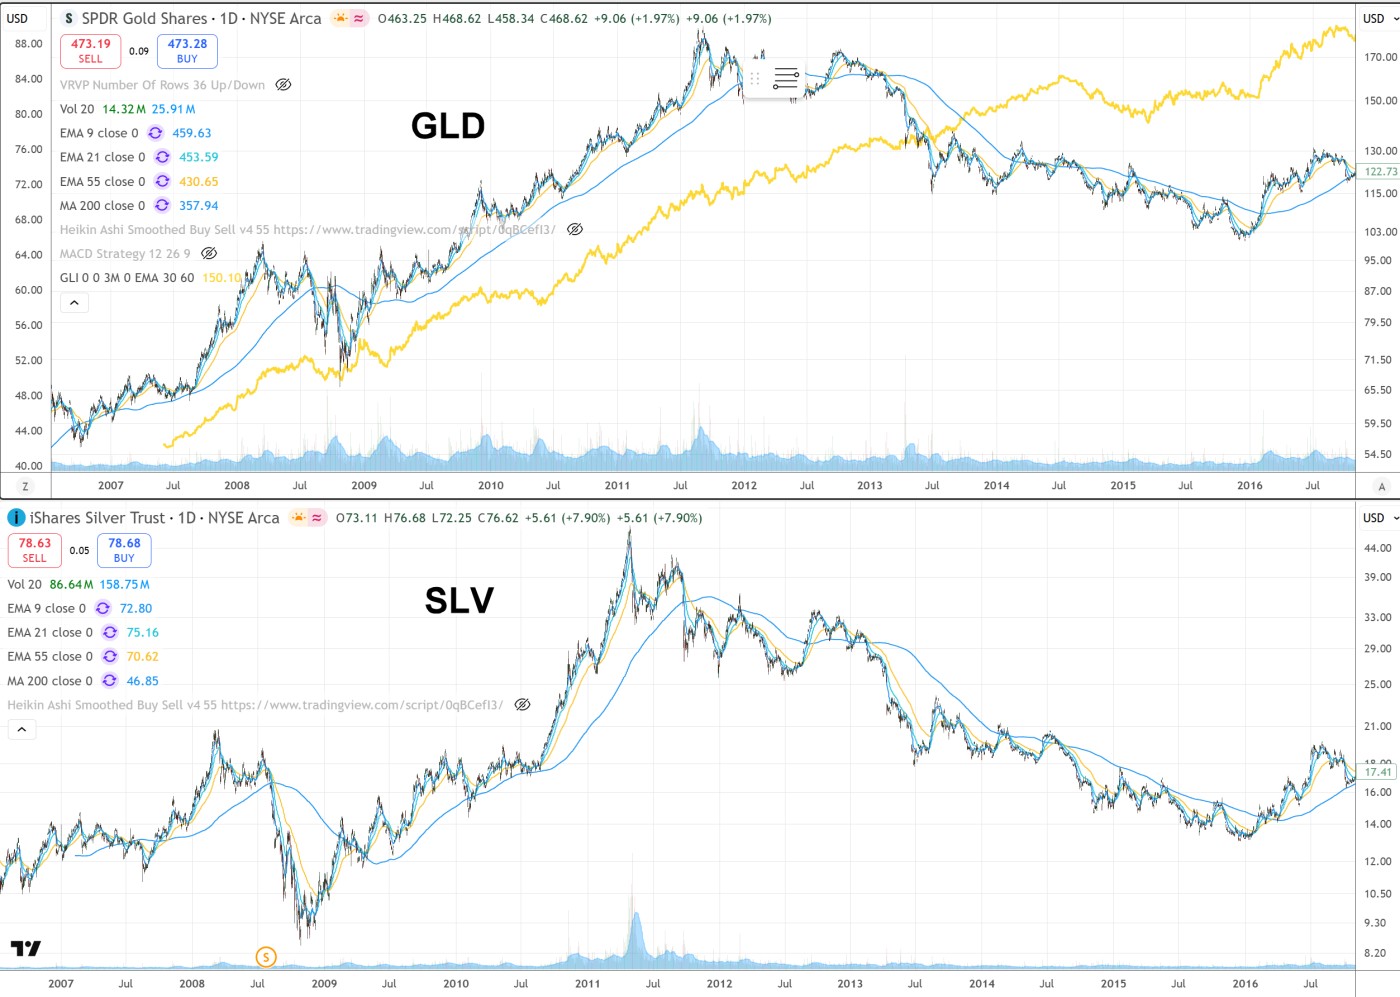
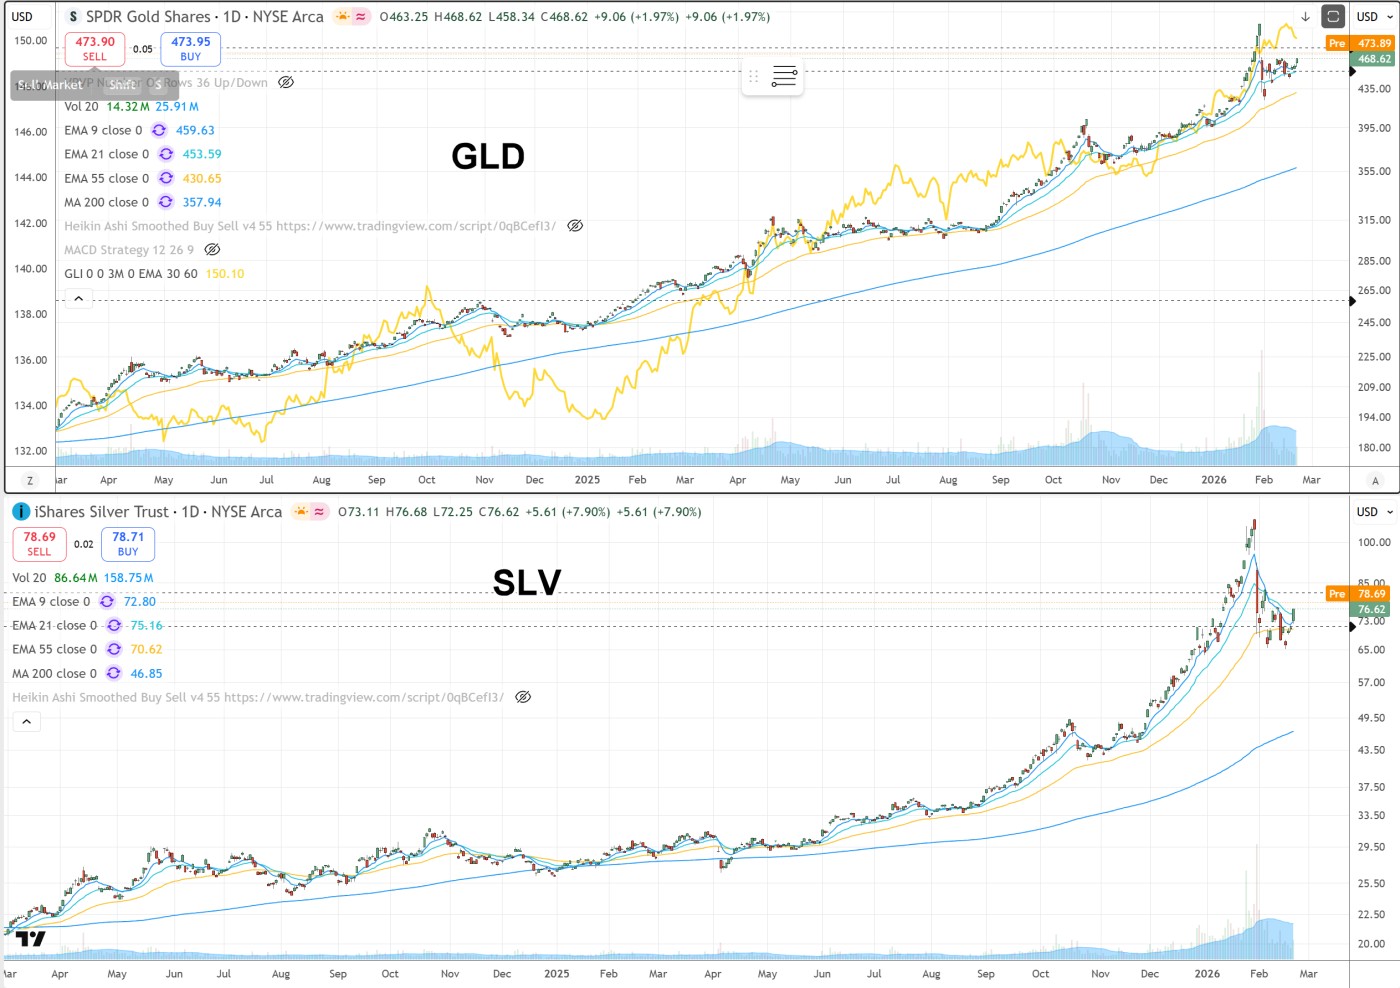
The **mid-2011 tops** in gold (~$1,920/oz in September) and silver (~$49.80/oz in April) marked the end of a powerful bull market that began after the 2008 crisis. Gold fell ~45% to ~$1,050 by late 2015, while silver crashed ~70% to ~$14. The current rally (gold ~$5,000–$5,100/oz, silver ~$80–$85/oz as of late February 2026) shares some similarities but has **key structural differences** that make a repeat of the 2011–2015 bear market much less likely.
Key Reasons for the 2011 Peak and Subsequent Decline
1. **Post-2008 Crisis Safe-Haven and QE-Driven Rally (2009–2011)**
- The 2008 financial crisis triggered massive fear of systemic collapse, inflation from QE (quantitative easing), and currency debasement.
- Central banks (especially the Fed) launched QE1/QE2, printing trillions → investors piled into gold/silver as hedges.
- Geopolitical risks (Arab Spring, Eurozone debt crisis, U.S. debt ceiling fights) added fuel.
- Silver's industrial demand was strong pre-peak, amplifying the move.
2. **Peak and Reversal Triggers (Mid-2011)**
- **Overbought speculation** → Extreme retail/investor positioning (CFTC long positions at records) led to profit-taking.
- **Improving macro outlook** → U.S. economy stabilized, Eurozone fears eased slightly, QE2 ended (June 2011), reducing "money printing" narrative.
- **Stronger USD** → Fed signaled pause; dollar rallied, pressuring gold/silver (priced in USD).
- **Silver-specific crash** → April 2011 "Silver Thursday"-like event (margin calls, forced selling) after parabolic run; Hunt Brothers-style leverage unwound.
3. **2012–2015 Decline Drivers**
- **Fed tapering talk** → Bernanke hinted at QE wind-down (2013 "taper tantrum") → higher real yields → gold/silver lost appeal vs. bonds/stocks.
- **Economic recovery** → U.S. growth strengthened, stock market boomed (S&P 500 tripled 2009–2015) → risk-on shift away from safe havens.
- **Strong dollar** → USD index rose ~25% 2011–2015, crushing gold/silver prices.
- **Reduced physical demand** → India/China jewelry demand cooled; ETF outflows (GLD holdings dropped sharply).
- **Deflationary fears** → Global growth slowed (China slowdown, Eurozone crisis), hurting industrial silver demand (~50% of total).
The 2011 peak was fueled by crisis fear + QE/inflation hedge buying. The decline was driven by economic recovery, Fed tapering, stronger USD, reduced safe-haven demand, and unwinding of speculative excess.
Today's Similarities to 2011
- **Parabolic blow-off tops**: Both periods saw extreme speculation — 2011 had massive retail/ETF inflows and leveraged positioning; 2025–2026 has seen similar euphoria (silver briefly above $120, gold above $5,500).
- **Overbought conditions**: CFTC futures longs hit extremes in 2011; similar overcrowding appears now.
- **Macro reversal triggers**: 2011 peak followed QE2 end and early recovery signs; current rally faces potential Fed pivot surprises, tariff resolutions, or disinflation surprises that could cool momentum.
Key Differences from 2011 (Why higher highs are likely)
- **Central bank buying**: In 2011, central banks were net sellers or neutral. In 2025–2026, they are structural buyers (~1,000–1,200 tonnes/year for 3+ years), creating a strong floor. This is a game-changer; no equivalent backstop existed in 2011.
- **Industrial demand for silver**: Silver's industrial use (solar, EVs, electronics, AI chips) was weaker in 2011. Today, supply deficits persist (6th consecutive year in 2026), with physical shortages reported in Asia supporting prices even if investment cools.
- **Geopolitical & systemic risks**: 2011 had Eurozone fears; today’s backdrop includes U.S.-China tensions, tariffs, Iran risks, and ongoing de-dollarization; all sustaining safe-haven demand.
- **Dollar & rates environment**: The 2011–2015 decline coincided with a strong USD rally and Fed tapering. Current expectations are for lower rates in 2026, weakening the dollar and supporting gold/silver.
- **Inflation backdrop**: 2011 saw disinflation fears; 2026 has sticky services inflation and fiscal deficits favoring precious metals as hedges.
Price Outlook & Downside Risk
- **Base case**: Gold likely tests $5,200–$5,500+ in 2026 (analysts like JPM ~$5,055 avg, BofA $6,000+); silver $80–$100+ (JPM $81 avg, some $135–$150). Corrections of 10–20% are normal in bull markets — not a 2011-style crash.
- **Downside risk**: A sharp 15–25% pullback is possible if Fed surprises hawkish, tariffs de-escalate, or speculative longs liquidate. But structural demand (central banks, deficits) limits deep bear markets.
**Verdict**: The 2011 top was driven by post-crisis speculation unwinding into recovery. Today’s rally rests on stronger fundamentals — central-bank demand, industrial shortages, and persistent risks — making a repeat multi-year collapse unlikely. Expect volatility and pullbacks, but the path remains higher over the next 6–18 months.