Market Lab Report / Dr. K's Crypto-Corner
by Dr. Chris Kacher
The Metaversal Evolution Will Not Be Centralized™
Home Prices Peaked?
Many think home prices have to tumble along with everything else in a recession. This would be true if the recession was one of great magnitude such as the one caused by the financial collapse of 2008 known as The Great Recession or The Great Depression of the 1930s. But during other recessions of lesser magnitude or duration, home prices dropped for roughly a year or so, but then quickly stabilized, after which they either their continued higher in their long term uptrend or moved sideways for a couple of years before continuing in their long term uptrend such as after the bursting of the 1990 housing bubble. Even the C19 pandemic which caused a short and sharp collapse in early 2020 pushing everything down massively for a month only caused home prices in the U.S. to dip slightly in May-2020 and in the EU in Mar-2020. Indeed, home prices can continue to appreciate even during recessions though their price ascent may flatten or slightly dip as recent reports suggest.
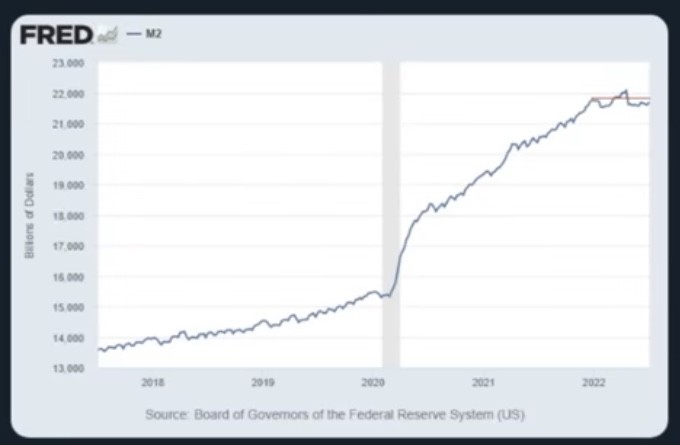
That said, in the current bubble, home prices have been on their steepest ascent in decades due to the record levels of M2 created from QE, so it is possible when combined with a severe recession, that home prices could have a steeper than normal drop for a year or so until the Fed halts the hikes or launches QE5. Indeed, mortgage demand is at its lowest since the year 2000 while supply in up since 2019. We are also seeing more price reductions in several years.
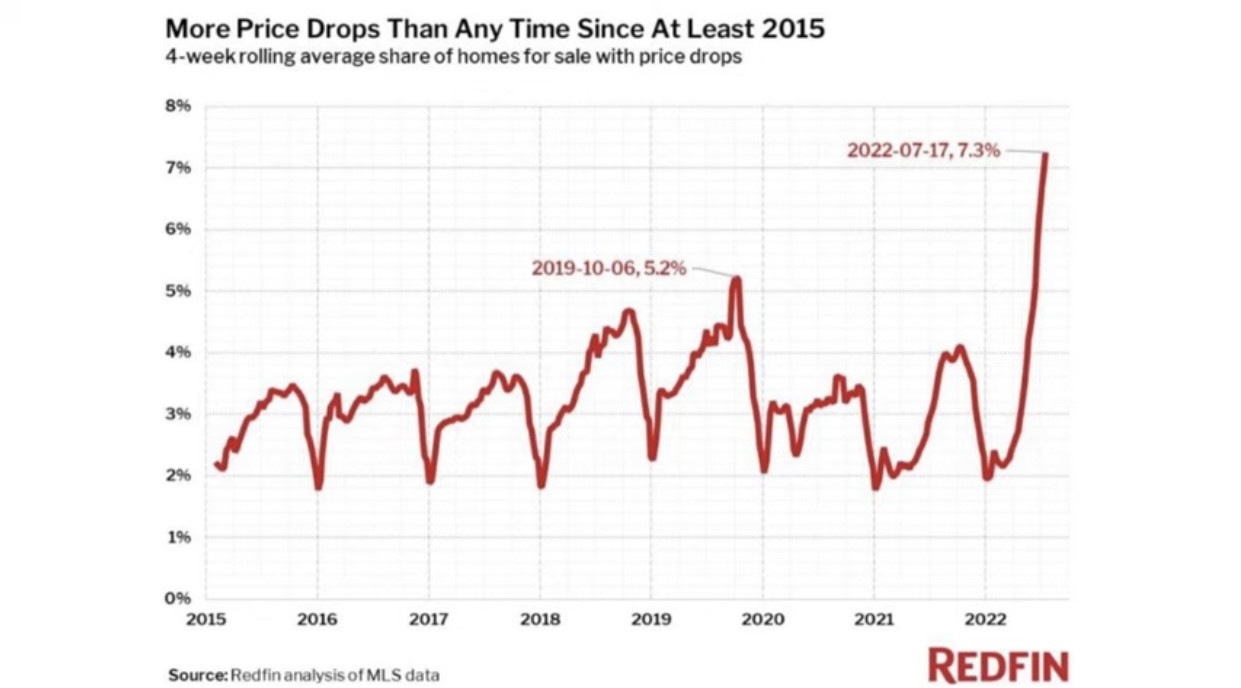
In consequence, home sales were down 16% in June and the average home price in the U.S. fell 12% over the last 2 months, the largest drop in history over such a short timeframe.
Housing industry groups should therefore continue in their downtrends along with most everything else, though one could look for those names that are bucking the overall trend. Gems are often revealed in bear markets. While no gems yet, low risk plays can arise. Company ticker: O (Realty Income Corp) which is a retail REIT is trying to buck trend during this bear market but its alpha is very low so would probably put most alpha traders to sleep.
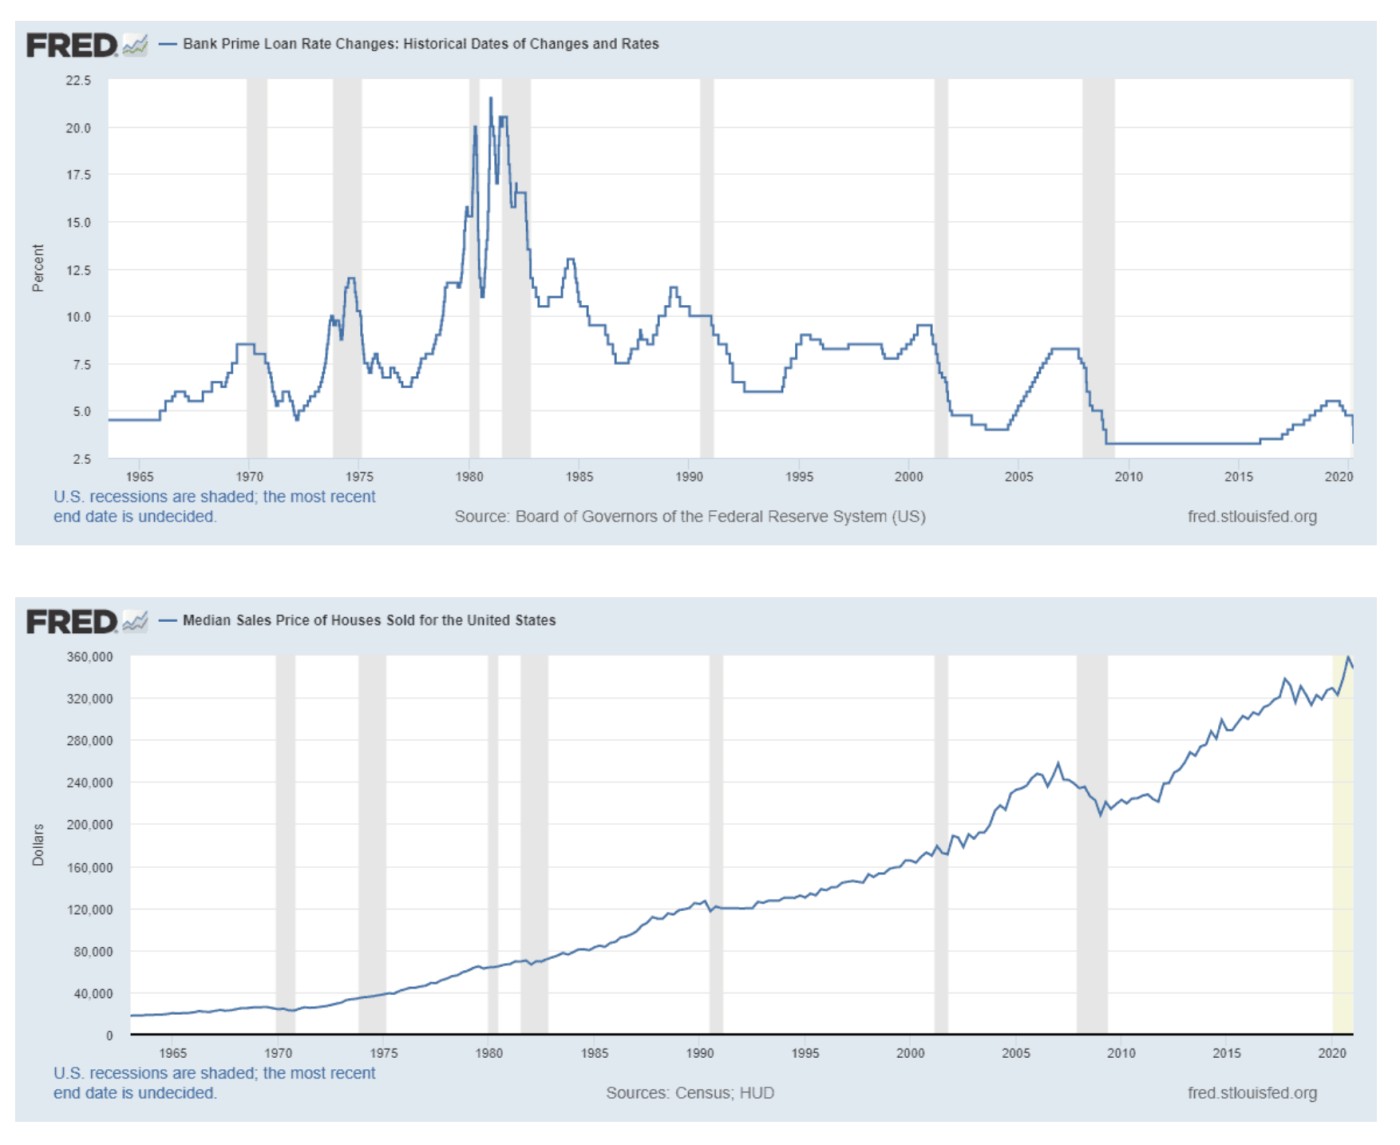 Housing cycles are some of the longest in duration of the asset classes as they tend to last for well over 10 years such as the one from 1971-1990, or 1993-2006. By the way, both prior cycles were called bubbles. We are still in the current bubble as home prices recovered after the financial collapse in 2008 then started into their ascent in 2009 to where they are today. So we have a 20-year, 15-year, and current 14-year housing cycle.
Even the bursting of the dot-bom bubble nor the stagflationary 1970s when 30-year fixed mortgage rates ripped higher materially slowed home prices, though they did cause price volatility, ie, three steps forward, two-and-a-half steps back.
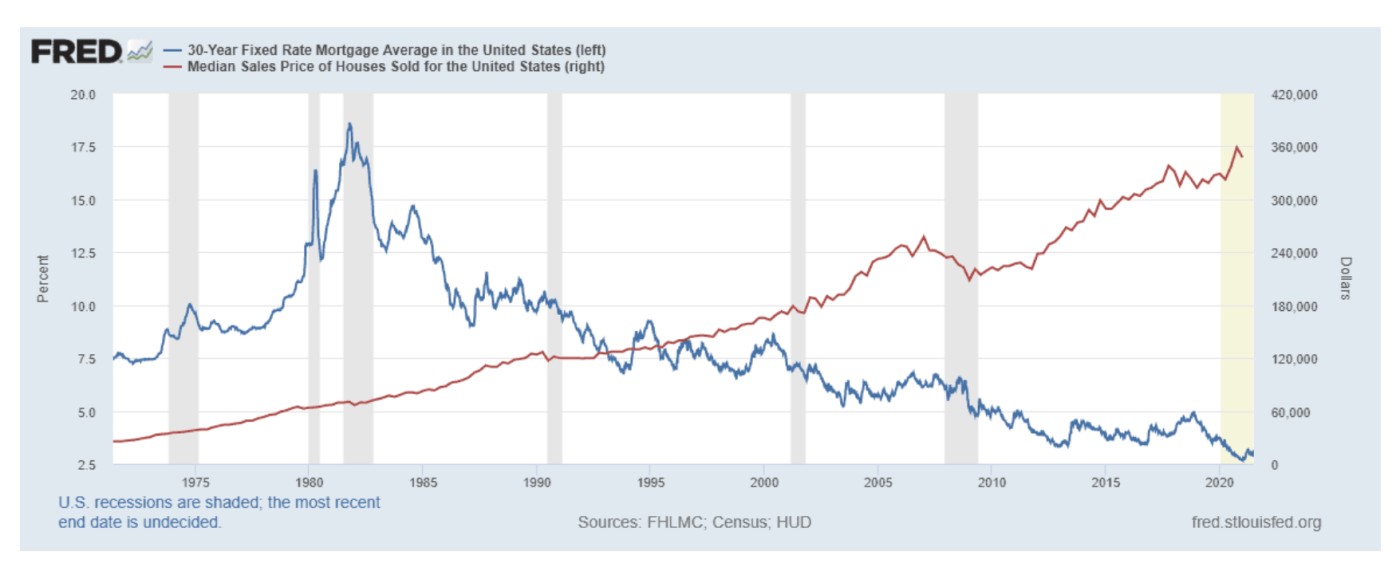
Housing cycles are some of the longest in duration of the asset classes as they tend to last for well over 10 years such as the one from 1971-1990, or 1993-2006. By the way, both prior cycles were called bubbles. We are still in the current bubble as home prices recovered after the financial collapse in 2008 then started into their ascent in 2009 to where they are today. So we have a 20-year, 15-year, and current 14-year housing cycle.Even the bursting of the dot-bom bubble nor the stagflationary 1970s when 30-year fixed mortgage rates ripped higher materially slowed home prices, though they did cause price volatility, ie, three steps forward, two-and-a-half steps back.
Markets
The CPI came in 0.2% below expectations including core for both M/M and Y/Y. Many are wondering when the Fed will indicate they are halting rate hikes or launching QE5. The 2- and 10-year Treasury yield spread, a great harbinger of recession, was just the most negative since the dot-bom bust in the year 2000. Even with inflation tamer than expected at 8.5% (core 5.9%), we are nowhere near the Fed's target 2% rate. Since rate hikes take time to affect the economy, the worst of the recession may not be sometime until mid-2023. CME Fed Futures predict 3 more rate hikes for this year of 50, 50, and 25 bps which would bring the FFR to 350-375. But with debt at record levels, rates cannot get to the Fed's targeted 3.6% without greatly upsetting markets due to the debt service which impacts GDP.
The CPI came in 0.2% below expectations including core for both M/M and Y/Y. Many are wondering when the Fed will indicate they are halting rate hikes or launching QE5. The 2- and 10-year Treasury yield spread, a great harbinger of recession, was just the most negative since the dot-bom bust in the year 2000. Even with inflation tamer than expected at 8.5% (core 5.9%), we are nowhere near the Fed's target 2% rate. Since rate hikes take time to affect the economy, the worst of the recession may not be sometime until mid-2023. CME Fed Futures predict 3 more rate hikes for this year of 50, 50, and 25 bps which would bring the FFR to 350-375. But with debt at record levels, rates cannot get to the Fed's targeted 3.6% without greatly upsetting markets due to the debt service which impacts GDP.
Back in 2018, as the Fed continued to hike rates, markets finally started into a sharp downtrend in late 2018 culminating in the first Xmas crash on Dec 24, normally a sleepy and mildly bullish trading day. The Fed chair immediately went live telling markets what they wanted to hear- that balance sheet tightening would be put on hold. That was the major low for both stocks and bitcoin. I believe we will see a rhyme of what happened in 2018 later this year given that central banks remain in a tightening phase. The Bank of England raised rate by 50bps to 1.75% the other day, the largest increase since 1995. The BoE predicts its CPI inflation to peak at over 13% by October.
That said, in the U.S., M2 has been sideways all year which explains the bear markets in both stocks and cryptocurrencies. The idea that the Fed can materially reduce M2 goes against hundreds of years of market cycles. Ultimately, the Fed will have to stop the hikes or crash the markets. Eventually, QE5 will launch due to a new crisis or some nonsense and costly political package such as the Inflation Reduction Act which actually increases debt in the long term as it subsidizes uneconomic clean energy and clean agriculture spurring inflation while increasing taxes on individuals and corporations. Indeed, it doubles the size of the IRS as 87,000 new tax agents will be hired to handle 1.2 million new audits a year with the majority targeting those who earn under $75k/year. Uncle Sam is getting even more ornery in his old age as the government is broke and couch diving for change.