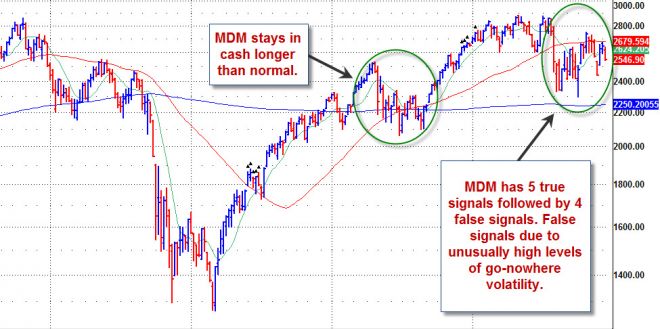
Since August, when the market went into one of the most choppy, volatile, go-nowhere modes in many years, the Market Direction Model has had 5 true signals in a row, follow by 4 false signals in a row. Overall, this is better than would normally be expected in such an environment.
As shown in the figure below, the most recent go-nowhere market action shown by the second circle has been one of the most choppy in the 40-year history of the NASDAQ Composite.
Following the May 2010 flash crash as shown by the first circle, the model stayed in cash longer than normal due to the ensuing directionless volatility which often follows such a large break in the market, also evidenced by price/volume action of leading stocks. After a big score on its April 28, 2010 sell signal of +10.3% on the NASDAQ Composite, it had three signals, fewer than it normally would have had. Two of these signals were profitable.
In the current environment, the model had a big score on its August 2, 2011 sell signal of +11.6%, followed by four more profitable signals, for a total of five in a row. It is highly unusually for the model to have five true signals in a row, but the markets were behaving in an unusually predictable manner following the big downside break in early August. That said, starting with its buy signal on October 19, 2011 it has had four false signals in a row (counting today). As we have said in prior reports, due to abnormally high levels of volatility, the fail-safe which usually contains losses to within -2% on the NASDAQ Composite could be somewhat larger, and indeed has been between -1.6% and -3.1%. We have thus suggested that some members may wish to pyramid in more slowly so they lose less should the signal prove false.
While trading volumes during the last two weeks of December tend to be lighter as the big moneyed institutions go on holiday, retail volume can continue these abnormally high levels of volatility that have shown no sign of calming.
What we have observed in reading hundreds of books on the markets, including ones published before 1930, and some in the 19th century, is that when investors start to throw in the towel in frustration at a trendless environment, and trend following is declared dead (which has happened numerous times over the last century), that is the time when profit opportunities arise. Trends, either up or down, tend to begin when least expected. The August 2011 drop was as unexpected at the May 2010 flash crash. The Market Direction Model was able to capitalize on both, as it has been able to do in prior big drops in the market by doing what it does best- sensing buying and selling pressure in relevant/leading indices and stocks.
The ongoing battle should continue between the positive effects of quantitative easing vs. bad news out of Europe along with the question of whether central banks will print enough money to buoy the markets. In the meantime, the model will lick its wounds, and continue to stay vigilant, knowing that the recent false signals are a consequence of the unusually choppy, trendless market which will have an endpoint, as a new window of opportunity opens.