While we do not like to put too much importance into chart pattern similarities, history, while it does not repeat, does often rhyme.
The chart below shows the market from 1/19/06 - 9/25/11 and from 10/9/07 - 9/20/11.
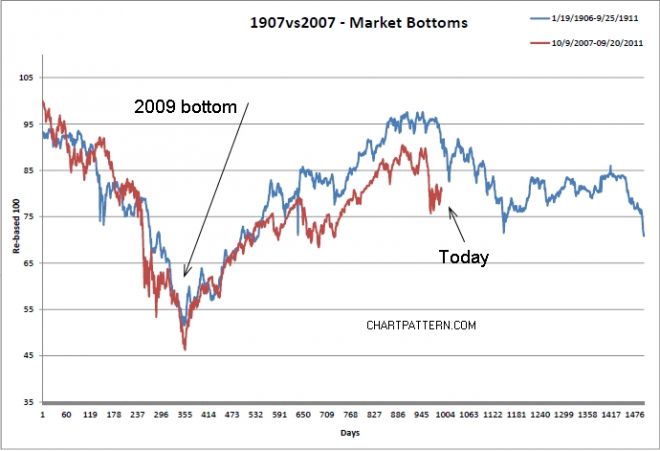
While the charts do appear similar so far, times were quite different between then and now so it would be a mistake to assume that the pattern will trace out in similar fashion. As always, it is best to monitor buying and selling pressure by way of price/volume action in the major indices and leading stocks on a real-time basis.
The earthquake in 1906 led to insurance claims in 1907 which created massive burden to insurance companies that set off the panic of 1907. The market then recovered and enjoyed a bull market until the start of 1910 when recession began and stayed until the end of 1911, or nearly two years.
The correction which started in August 2011 could be the market telegraphing that a global recession has started since markets are often forward looking by 6 to 9 months when it comes to recessions.
Thanks to Cyrus for providing the chart.
PS: The three stocks I will be mentioning as potential long plays today on CBS Portfolio Doctor are PCLN, CMG, and HANS, though I personally would not buy any of them in this environment. That said, some people who watch this show cannot short and might also be longer term holders of stock (out to years).
This information is provided by MoKa Investors, LLC DBA Virtue of Selfish Investing (VoSI) is issued solely for informational purposes and does not constitute an offer to sell or a solicitation of an offer to buy securities. Information contained herein is based on sources which we believe to be reliable but is not guaranteed by us as being accurate and does not purport to be a complete statement or summary of available data. VoSI reports are intended to alert VoSI members to technical developments in certain securities that may or may not be actionable, only, and are not intended as recommendations. Past performance is not a guarantee, nor is it necessarily indicative, of future results. Opinions expressed herein are statements of our judgment as of the publication date and are subject to change without notice. Entities including but not limited to VoSI, its members, officers, directors, employees, customers, agents, and affiliates may have a position, long or short, in the securities referred to herein, and/or other related securities, and may increase or decrease such position or take a contra position. Additional information is available upon written request. This publication is for clients of Virtue of Selfish Investing. Reproduction without written permission is strictly prohibited and will be prosecuted to the full extent of the law. ©2026 MoKa Investors, LLC DBA Virtue of Selfish Investing. All rights reserved.
