
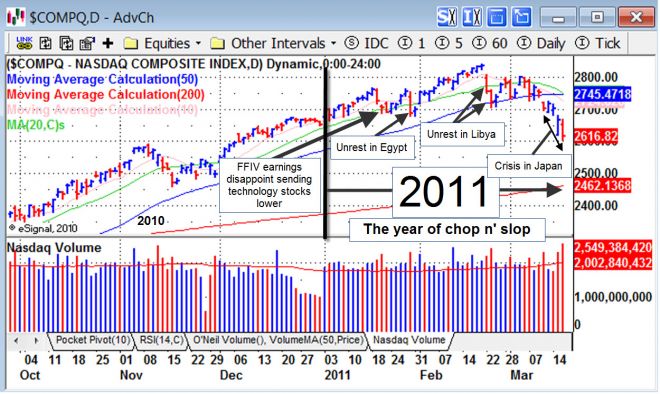
2011 has been so far a most challenging period since the NASDAQ Composite has not really made much progress either up or down. So far, it has been a period of what one could call chop n' slop. Such environments do come to an end.
To help provide some perspective, here is an email we received today from a subscriber. Our responses are in bold:
Member: I am a relatively new subscriber trying to be disciplined in following your Market Direction Model (MDM) signals. I did pretty well on your sell signal of 3/8/11 with a 100% 1X inverse QQQQ's and was surprised when you switched to a Buy on 3/15/11 since Investors Business Daily is saying the market is still in correction. However, you explained why your model sometimes steps outside the rules in unusual situations which makes sense. [ed: MDM returns vs. IBD shown here: https://www.virtueofselfishinvesting.com/faqs/answer/How-has-Dr-K-MDM-systematic-model-done-against-some-of-the-best-timing-sites-on-the-internet]
Member: As you explained, the risk reward still looked favorable. Just some feedback on my experience after your buy signal of 3/15/11: I bought an 80% position in the QQQQ's and the equivalent of 20% in AGQ, then with this morning's APPL related alert to sell any Q's, I sold my Q's and bought 80% JJS followed by your MDM switch to neutral, so I sold everything and ended up with a 3% loss since yesterday's buy signal through a combination of not always being at my computer so not buying or selling at that exact time as the email is sent (usually I check every hour or two at the most). Also, I switched from Q's to JJS today. That said, I am still inspired by your book and your long term success and I am counting on the MDM when a longer term trend actually occurs, but this whipsaw period is very frustrating. This is understandable as such periods are frustrating, and it is most challenging to know when a sideways choppy market will end and when a new trend will resume. Fortunately, such periods tend to be short-lived and always come to an end. While the current trend seems to be down, oversold action combined with leading stocks holding up in the wake of this selloff (PPO, NFLX, LULU, BIDU, OPEN, ARUN, PAY, NETL, XLNX, etc) points to a strong probability of a bounce in the coming days. Further, Japan's nuclear crisis is liable to resolve sooner than later, and as of this writing, helicopters are dropping water on the reactor to cool it down; the Nikkei has bounced.
The pattern of the model's returns captures uptrends then limits losses on false signals, such as during whipsaw markets. This can be seen over the last many signals using, as one example, the TYH. There are striking differences between 2011 and 2010:
2011 Chop n' Slop Market
Date of Signal / Signal / % gain or loss
03-16-2011 Cash
03-15-2011 Buy -3.71%
03-08-2011 Sell +12.84%
03-03-2011 Buy -7.6%
02-23-2011 Cash +3.69%
02-01-2011 Buy -3.66%
01-31-2011 Sell -8.34%
01-20-2011 Cash
01-12-2011 Buy +3.76%
2010 Trending Market (same with 2009)
Date of Signal / Signal / % gain or loss
12-08-2010 Sell -2.78%
12-07-2010 Buy -2.79%
12-01-2010 Cash
11-16-2010 Sell -8.07%
09-01-2010 Buy +46.54%
08-11-2010 Sell +12.07%
07-07-2010 Cash
06-30-2010 Sell -8.52%
06-07-2010 Cash
05-25-2010 Buy -1.74%
04-28-2010 Sell +27.57%
04-22-2010 Cash
04-19-2010 Sell -2.99%
03-01-2010 Buy +20.79%
02-18-2010 Cash
01-27-2010 Sell -1.04%
01-07-2010 Cash
01-04-2010 Buy -3.12%
Member: One last point which is caused by the whipsawing and that some of your other subscribers might be encountering: I am getting a notice from my brokerage-Fidelity- that if after a sell, if I buy and then sell again before the first sell clears (I believe a 3 day period) that I will be in danger of a "good faith" violation. This occurred with my wife's IRA account because she is following your MDM model and is using 100% of her cash balance. I have margin on my account so I haven't run into this problem yet, but it would be very frustrating to not be able to follow all of the signal changes due to this problem. I am going to start using 2 or 3X ETF's to equal a 100% position while still maintaining cash in my account to minimize this problem. Is this a problem other subscribers have run into and how would you advise in a general sense? Most of our subscribers have not reported this problem as most have regular cash or margin accounts. However, the few that are trading IRA accounts should be aware of such trading rules that may hamper the activity of their trading. Using 2-times or 3-times ETFs that only use up part of the cash in their account as you have done is a good way to prevent such limitations while still being able to participate. For conservative investors, a 25% position in a 2-times ETF such as QLD/QID (which mirrors 2-times the NASDAQ-100) is effectively a 50% position. For aggressive investors, a 50% position in a 3-times ETF that approximates the NASDAQ Composite such as TQQQ or TYH is effectively a 150% position in the NASDAQ Composite. I know this is an extremely unusual time with QE2, Japan, etc but it is a most challenging time due to the current unusual whipsawing. Thanks for all of your efforts to provide the best investment information for us as I know it isn't easy right now and you are doing your best.